Gold for Thursday, March 26, 2015
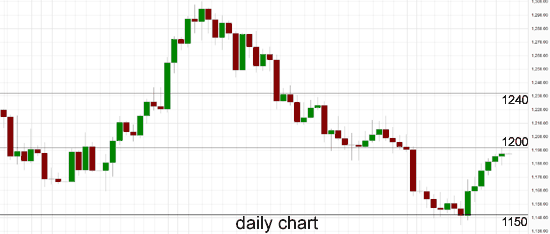
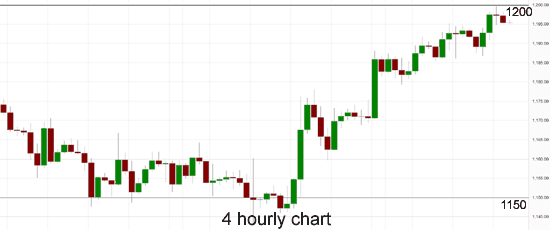
Throughout last week or so gold has shown some life and reversed by moving strongly off the support at $1150 up to a two week high just shy of the key $1200 level. It has eased lower a little back near $1150 where it is presently consolidating and trading around. It still has its eyes firmly on the key $1200 level however selling pressure from this level is likely and is already being felt. Prior to the recent move, gold remained quite steady enjoying strong support from the $1150 level whilst some eyes would have been looking lower. The next obvious technical support level lower is around $1130, and if it was to move through this level, then it would be trading at multi-year lows and looking very bearish. When gold broke through the rock solid support level at $1200 recently, it opened itself up to some potential downside which has been played out in the last week or so. Throughout the second half of February gold enjoyed rock solid support from the key $1200 level which held it up on numerous occasions. For about a month gold drifted steadily lower down to a one month low near the key $1200 level before finding the solid support at this key level.
Gold has now undone all of its great work from earlier in the year which saw it surge to a five month high near $1308, before reversing and moving back to $1150. At the beginning of December gold eased lower away from the resistance level at $1240 yet again back down to below $1200. During the second half of November gold made repeated runs at the resistance level at $1200 failing every time, before finally breaking through strongly. Throughout the first half of November Gold enjoyed a strong resurgence back to the key $1200 level where it has met stiff resistance up until recently.
Throughout the second half of October gold fell very strongly and resumed the medium term down trend falling from above $1250 back down through the key $1240 level, down below $1200 to a multi year low near $1130. It spent a few days consolidating around $1160 after the strong fall which has allowed it to rally higher in the last couple of weeks. Earlier in October Gold ran into the previous key level at $1240, however it also managed to surge higher to a five week high at $1255. In late August Gold enjoyed a resurgence as it moved strongly higher off the support level at $1275, however it then ran into resistance at $1290. In the week prior, Gold had been falling lower back towards the medium term support level at $1290 however to finish out last week it fell sharply down to the previous key level at $1275.
Gold hit 2-1/2-week highs on Wednesday, rising for the sixth straight session as upbeat German sentiment data helped drive the euro higher against the dollar, and as expectations for an imminent U.S. interest rate rise receded. The euro was up 0.4 percent versus the U.S. currency after a survey on German business morale fueled expectations that a euro zone economic recovery is strengthening, extending gains after U.S. durable goods data missed expectations. Spot gold was up 0.2 percent at $1,195 an ounce, having earlier touched its highest since March 6 at $1,199.70. U.S. gold futures for April delivery settled up $5.60 an ounce, or by .5 percent, at $1,197. “(Gold is) grinding higher as traders are reluctant buyers at this stage … driven by lower bond yields and the current dollar wobble,” Saxo Bank’s head of commodity research Ole Hansen said. Gold’s six-day rally, its longest since August 2012, came after Federal Reserve chair Janet Yellen sounded a cautious note last week on the U.S. economy and potential interest rate increase. “This is a long overdue correction for gold and I think it’s going to continue to hit in the $1,200 level,” said Eli Tesfaye, senior market strategist for RJO Futures in Chicago.
(Daily chart / 4 hourly chart below)
Gold March 25 at 22:45 GMT 1195.4 H: 1199.8 L: 1186.7
Gold Technical
| S3 | S2 | S1 | R1 | R2 | R3 |
| 1150 | — | — | 1200 | 1240 | 1300 |
During the early hours of the Asian trading session on Thursday, Gold is trading in a narrow range right around $1195 after steadily moving higher over the last week or so. Current range: trading right below $1200 around $1195.
Further levels in both directions:
• Below: 1150.
• Above: 1200, 1240 and 1300.
OANDA’s Open Position Ratios
![]()
(Shows the ratio of long vs. short positions held for Gold among all OANDA clients. The left percentage (blue) shows long positions; the right percentage (orange) shows short positions.)
The long position ratio for Gold has moved back towards 60% as it rallied and steadied just below $1200. The trader sentiment is in favour of long positions.
Economic Releases
- 23:30 (Wed) JP CPI Core (Nation) (Feb)
- 23:30 (Wed) JP CPI Core (Tokyo) (Mar)
- 23:30 (Wed) JP Real Household Spending (Feb)
- 23:30 (Wed) JP Unemployment (Feb)
- 23:30 (Wed) JP Large Retailers Sales (Feb)
- 23:30 (Wed) JP Retail Sales (Feb)
- 09:00 EU M3 Money Supply (sa) (Feb)
- 09:30 UK Retail Sales (Feb)
- 12:30 US Initial Claims (21/03/2015)
Which stock should you buy in your very next trade?
AI computing powers are changing the stock market. Investing.com's ProPicks AI includes 6 winning stock portfolios chosen by our advanced AI. In 2024 alone, ProPicks AI identified 2 stocks that surged over 150%, 4 additional stocks that leaped over 30%, and 3 more that climbed over 25%. Which stock will be the next to soar?
Unlock ProPicks AI

