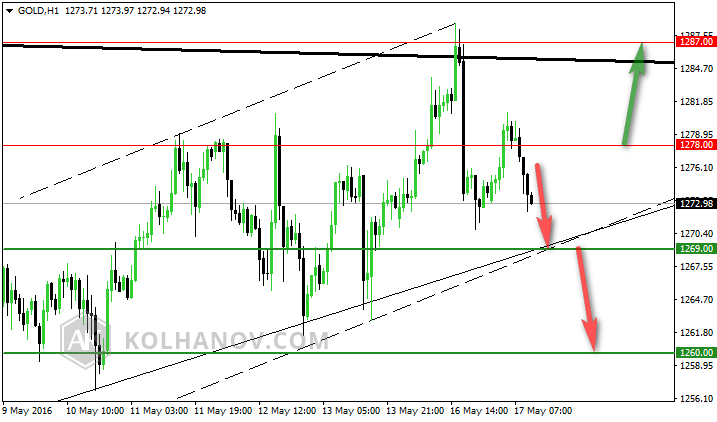
Daily forecast: break down of 1269 will open target on 1260
Main scenario:
The pair is trading along a downtrend with target on 1269 and if it keeps on moving down below that level, we may expect the pair to reach support level 1260.
Alternative scenario:
An uptrend will start as soon, as the pair rises above resistance level 1278, which will be followed by moving up to resistance level 1287.
previous forecast: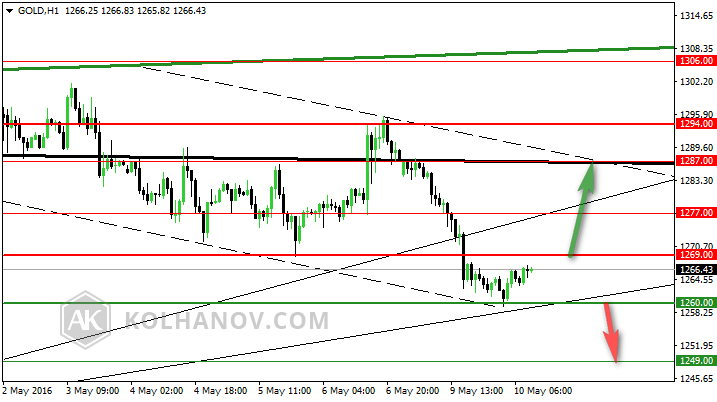
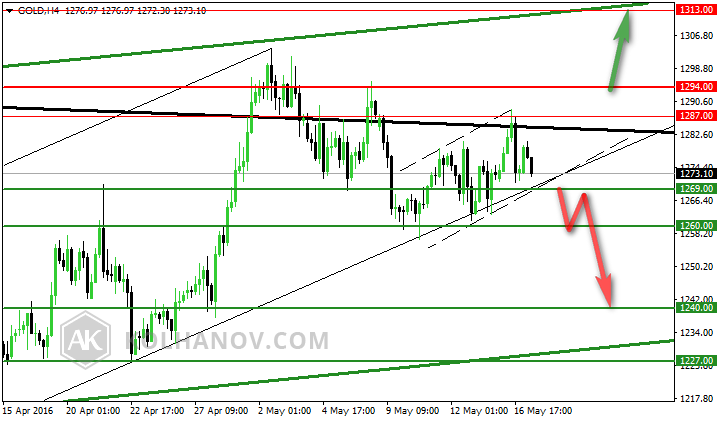
Weekly forecast, May 16 - 20: break down of 1269 will open target on 1240
Main scenario:
The pair is trading along an sideways trend between support 1269 and resistance 1294.
An downtrend will start as soon, as the pair drops below support level 1269, which will be followed by moving down to support level 1260 and 1240.
Alternative scenario:
An uptrend will start as soon, as the pair rises above resistance level 1294, which will be followed by moving up to resistance level 1313.
previous forecast: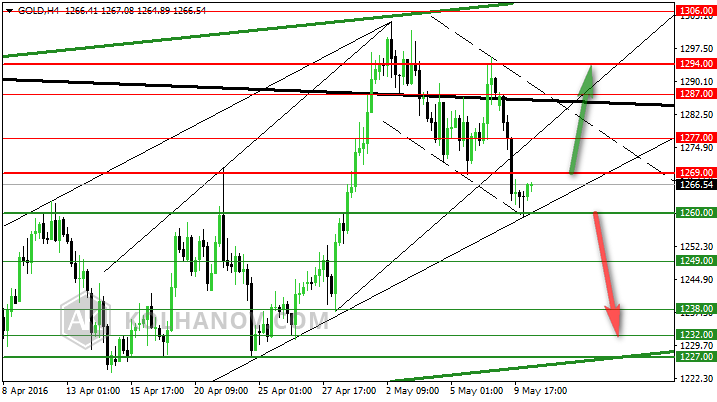
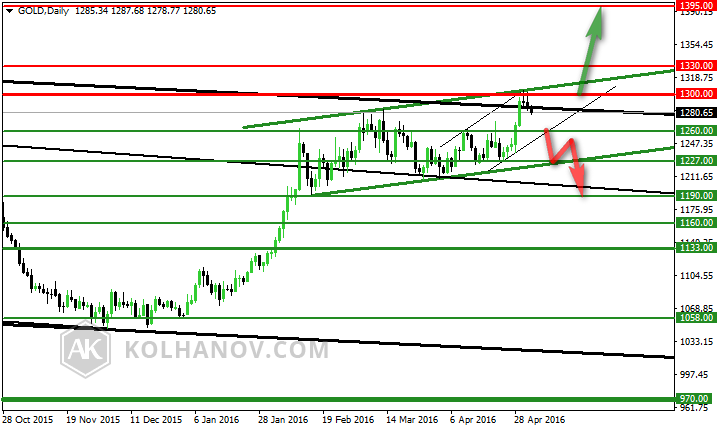
Monthly forecast, May 2016: with break down of 1260 market will fall to 1190
Main scenario:
The pair is trading along an sideways trend between support 1260 and resistance 1300.
An downtrend will start as soon, as the pair drops below support level 1260, which will be followed by moving down to support level 1190.
Alternative scenario:
An uptrend will start as soon, as the pair rises above resistance level 1300, which will be followed by moving up to resistance level 1395.
previous forecast: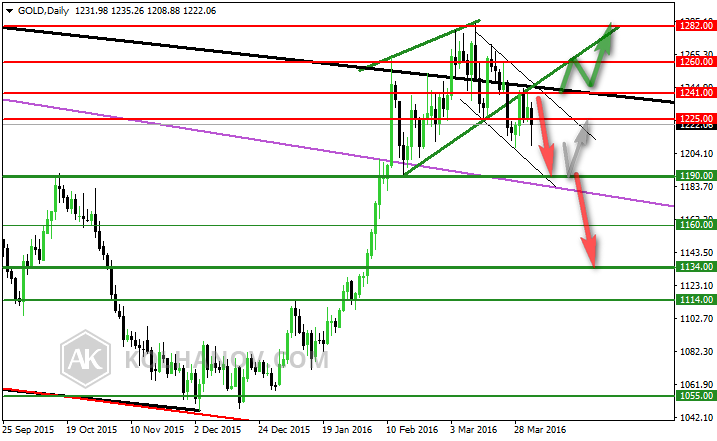
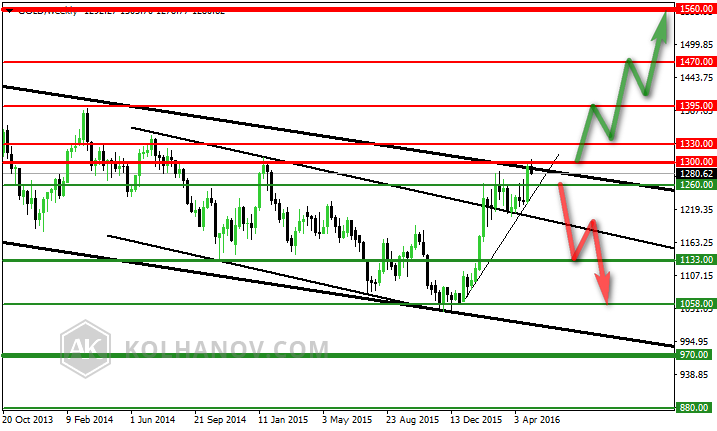
Quarterly forecast, April - June, 2016
Main scenario:
The pair is trading along an uptrend, that may be expected to continue in case the market rises above resistance level 1300, which will be followed by reaching resistance level 1395, 1470 and 1560.
Alternative scenario:
An downtrend will start as soon, as the pair drops below support level 1260, which will be followed by moving down to support level 1130 and 1058.
previous forecast: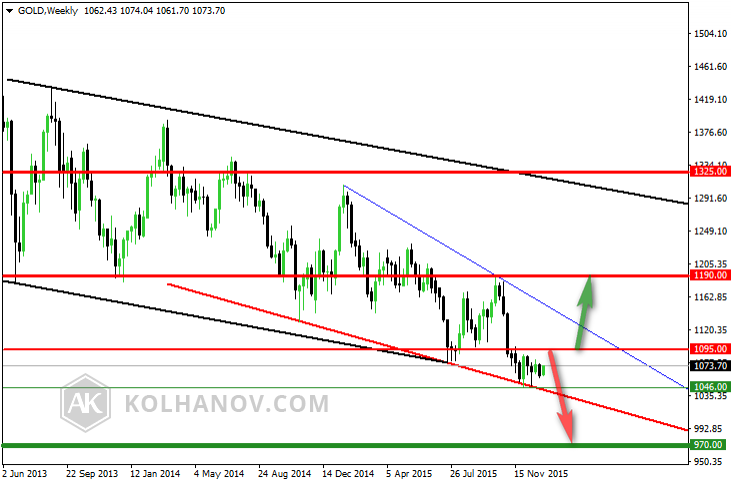
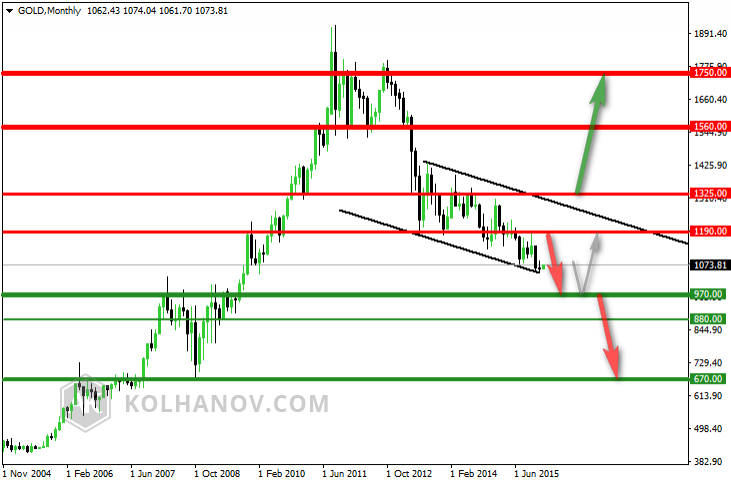
Yearly forecast, 2016
Main scenario:
The pair is trading along an downtrend with target on 970, and if it keeps on moving down below that level, we may expect the pair to reach support level 670, but in other way from 970 we can expect correcton on resistance level 1190.
Alternative scenario:
An uptrend will start as soon, as the pair rises above resistance level 1325, which will be followed by moving up to resistance level 1560 - 1750.
Which stock should you buy in your very next trade?
AI computing powers are changing the stock market. Investing.com's ProPicks AI includes 6 winning stock portfolios chosen by our advanced AI. In 2024 alone, ProPicks AI identified 2 stocks that surged over 150%, 4 additional stocks that leaped over 30%, and 3 more that climbed over 25%. Which stock will be the next to soar?
Unlock ProPicks AI