
Gold's Near-Term Outlook
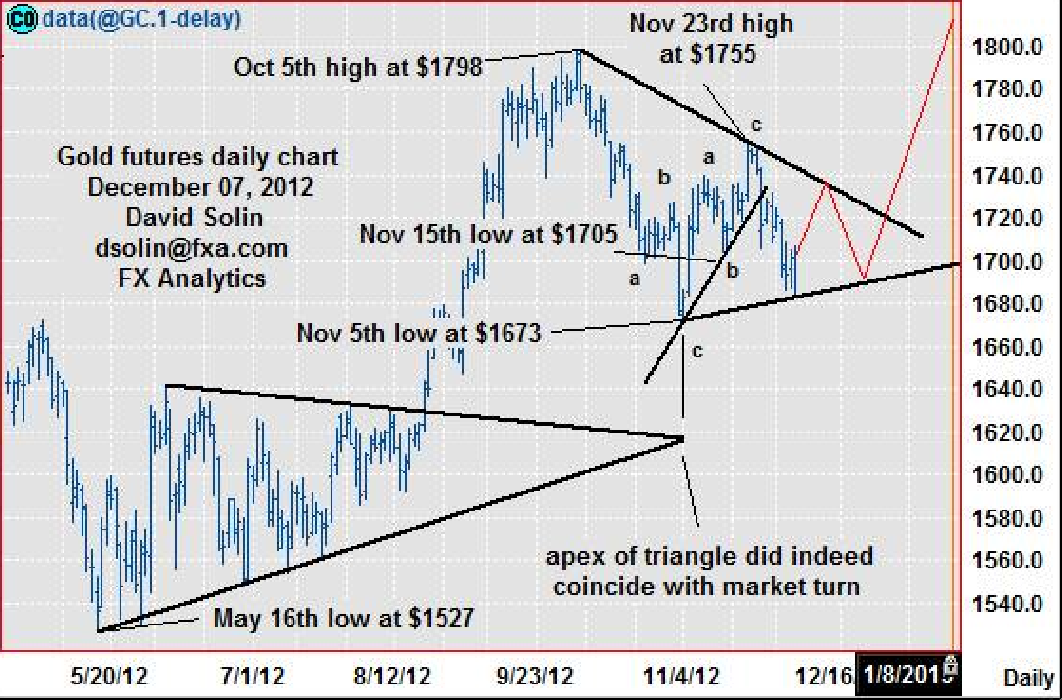
The market continues to consolidate from the Oct 5th high at $1798, potentially forming a triangle/pennant over that time. Though these are seen as continuation patterns suggesting an eventual upside resolution, another few weeks of trading in a tighter and tighter range is favored first (see "ideal" scenario in red on daily chart below). Note the series of 3 wave moves in both directions (a-b-c's) adds to the triangle view, as these patterns break down to a series of 5, 3 wave moves (also suggests another few weeks of ranging). Resistance is seen at 1717/20 (50% retracement from the Nov 23rd high at $1755) and the ceiling of the potential triangle/bear trendline from Oct (currently at $1742/45), while support is seen at the base (currently at $1681/84), and the Nov 5th low at $1671/74.
Strategy/Position
Given the view of more ranging nearby, would trade with a shorter term bias, looking to fade the extremes of the pattern. Since the timeframe is too short for the purposes of this email, would just be patient to allow this pattern to form, but with the expectation of buying for an upside resolution a few weeks ahead. Note, was stopped on the Nov 26th buy at $1748 on Nov 28th below the bull t-line from Nov 5th (then at $1731, closed at $1717).
Long-Term Outlook
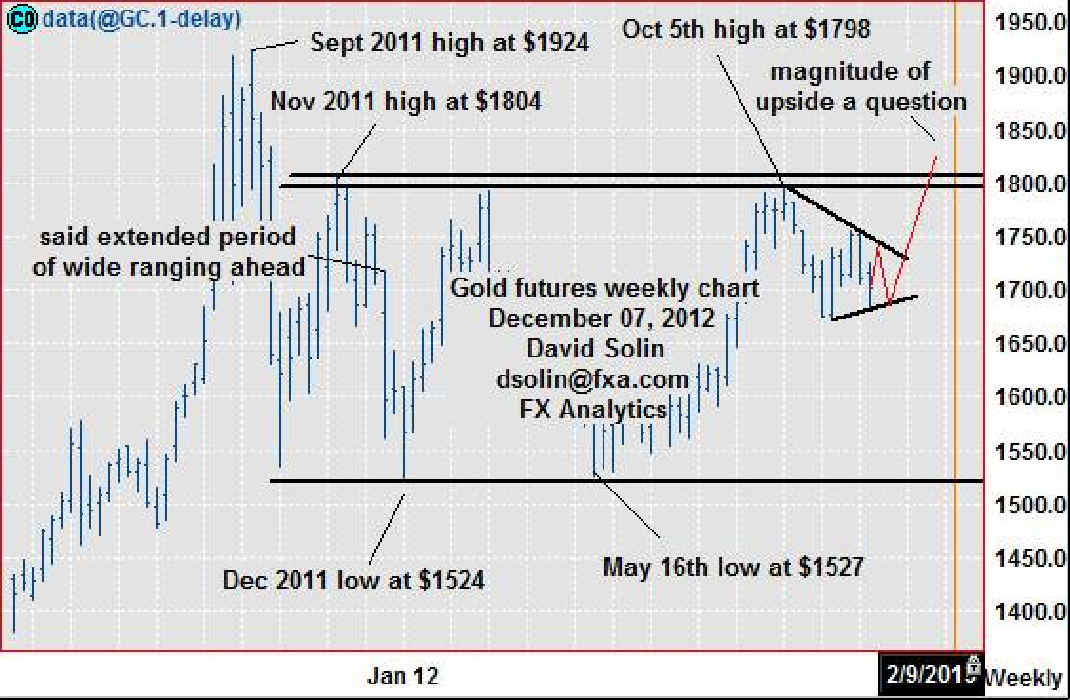
As discussed above, triangles/pennants are seen as continuation patterns suggesting an eventual upside resolution. But these patterns also have a number of other useful characteristics, including that they occur just before the final leg of a larger move (wave 4 or B in Elliott Wave terms, and higher in this case). So such a resolution upward is more likely to be a relatively short-lived move (from a longer term standpoint), and not the start of a more substantial upmove (at least time-wise). Also as discussed during Oct and early Nov, the apex of the triangle (where the lines meet) often coincides with turning points (as pointed out in the May/Aug triangle where the apex coincided with the Nov 5th low, see daily chart below). So the timing of that apex can/will be used to held determine when this upside from the resolution of the triangle might top (assuming this triangle scenario does indeed play out).
Strategy/Position
With an eventual upside resolution of the potential triangle favored, would stay with the longer term bullish bias that was put in place on Nov 26 at $1748 (got a bit caught).
The market continues to consolidate from the Oct 5th high at $1798, potentially forming a triangle/pennant over that time. Though these are seen as continuation patterns suggesting an eventual upside resolution, another few weeks of trading in a tighter and tighter range is favored first (see "ideal" scenario in red on daily chart below). Note the series of 3 wave moves in both directions (a-b-c's) adds to the triangle view, as these patterns break down to a series of 5, 3 wave moves (also suggests another few weeks of ranging). Resistance is seen at 1717/20 (50% retracement from the Nov 23rd high at $1755) and the ceiling of the potential triangle/bear trendline from Oct (currently at $1742/45), while support is seen at the base (currently at $1681/84), and the Nov 5th low at $1671/74.
Strategy/Position
Given the view of more ranging nearby, would trade with a shorter term bias, looking to fade the extremes of the pattern. Since the timeframe is too short for the purposes of this email, would just be patient to allow this pattern to form, but with the expectation of buying for an upside resolution a few weeks ahead. Note, was stopped on the Nov 26th buy at $1748 on Nov 28th below the bull t-line from Nov 5th (then at $1731, closed at $1717).
Long-Term Outlook
As discussed above, triangles/pennants are seen as continuation patterns suggesting an eventual upside resolution. But these patterns also have a number of other useful characteristics, including that they occur just before the final leg of a larger move (wave 4 or B in Elliott Wave terms, and higher in this case). So such a resolution upward is more likely to be a relatively short-lived move (from a longer term standpoint), and not the start of a more substantial upmove (at least time-wise). Also as discussed during Oct and early Nov, the apex of the triangle (where the lines meet) often coincides with turning points (as pointed out in the May/Aug triangle where the apex coincided with the Nov 5th low, see daily chart below). So the timing of that apex can/will be used to held determine when this upside from the resolution of the triangle might top (assuming this triangle scenario does indeed play out).
3rd party Ad. Not an offer or recommendation by Investing.com. See disclosure here or remove ads.
Strategy/Position
With an eventual upside resolution of the potential triangle favored, would stay with the longer term bullish bias that was put in place on Nov 26 at $1748 (got a bit caught).
Which stock should you buy in your very next trade?
With valuations skyrocketing in 2024, many investors are uneasy putting more money into stocks. Unsure where to invest next? Get access to our proven portfolios and discover high-potential opportunities.
In 2024 alone, ProPicks AI identified 2 stocks that surged over 150%, 4 additional stocks that leaped over 30%, and 3 more that climbed over 25%. That's an impressive track record.
With portfolios tailored for Dow stocks, S&P stocks, Tech stocks, and Mid Cap stocks, you can explore various wealth-building strategies.