Since then I have been looking for a reason and entry to be short. With the sideways motion for the last two weeks, it has done just that. The chart below shows that it has been building a descending triangle over support at 70 since February. The target on the break below takes it to 40. Both the bearish Relative Strength Index (RSI) and the Moving Average Convergence Divergence indicator (MACD) support more downside. The accumulation/distribution is rolling lower. Distribution confirming the rounding top was seen back on June 4. The short interest is less than 3%, so the risk of a squeeze is small. A close below 70 on the weekly chart seals the deal on the short trade.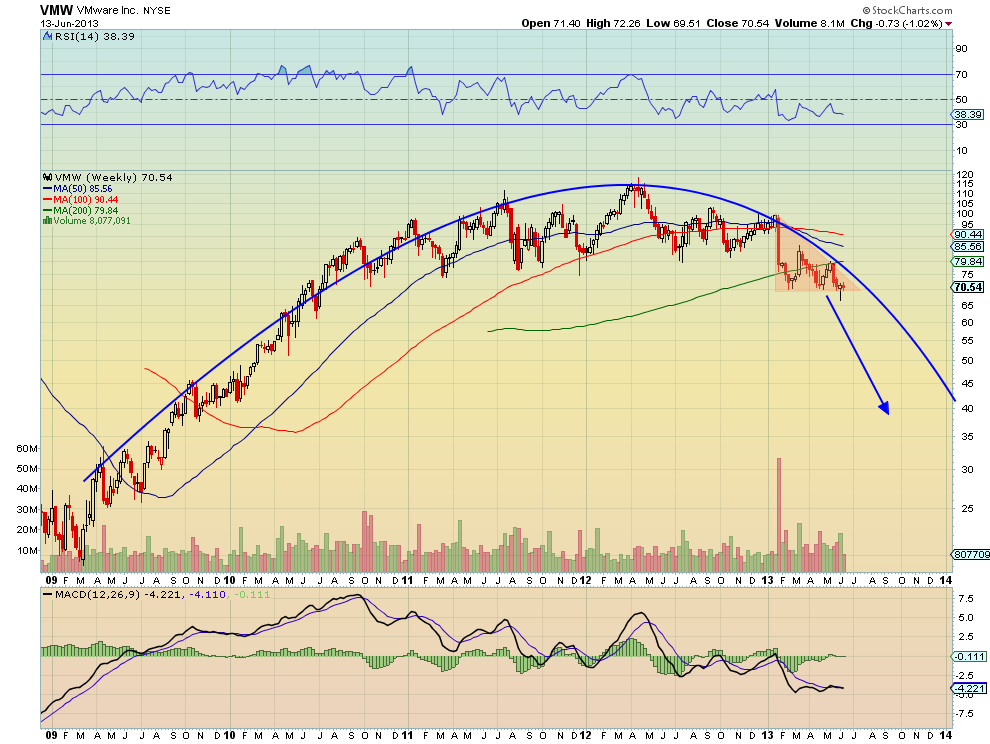
The information in this blog post represents my own opinions and does not contain a recommendation for any particular security or investment. I or my affiliates may hold positions or other interests in securities mentioned in the Blog, please see my Disclaimer page for my full disclaimer.
Original post
Which stock should you buy in your very next trade?
AI computing powers are changing the stock market. Investing.com's ProPicks AI includes 6 winning stock portfolios chosen by our advanced AI. In 2024 alone, ProPicks AI identified 2 stocks that surged over 150%, 4 additional stocks that leaped over 30%, and 3 more that climbed over 25%. Which stock will be the next to soar?
Unlock ProPicks AI