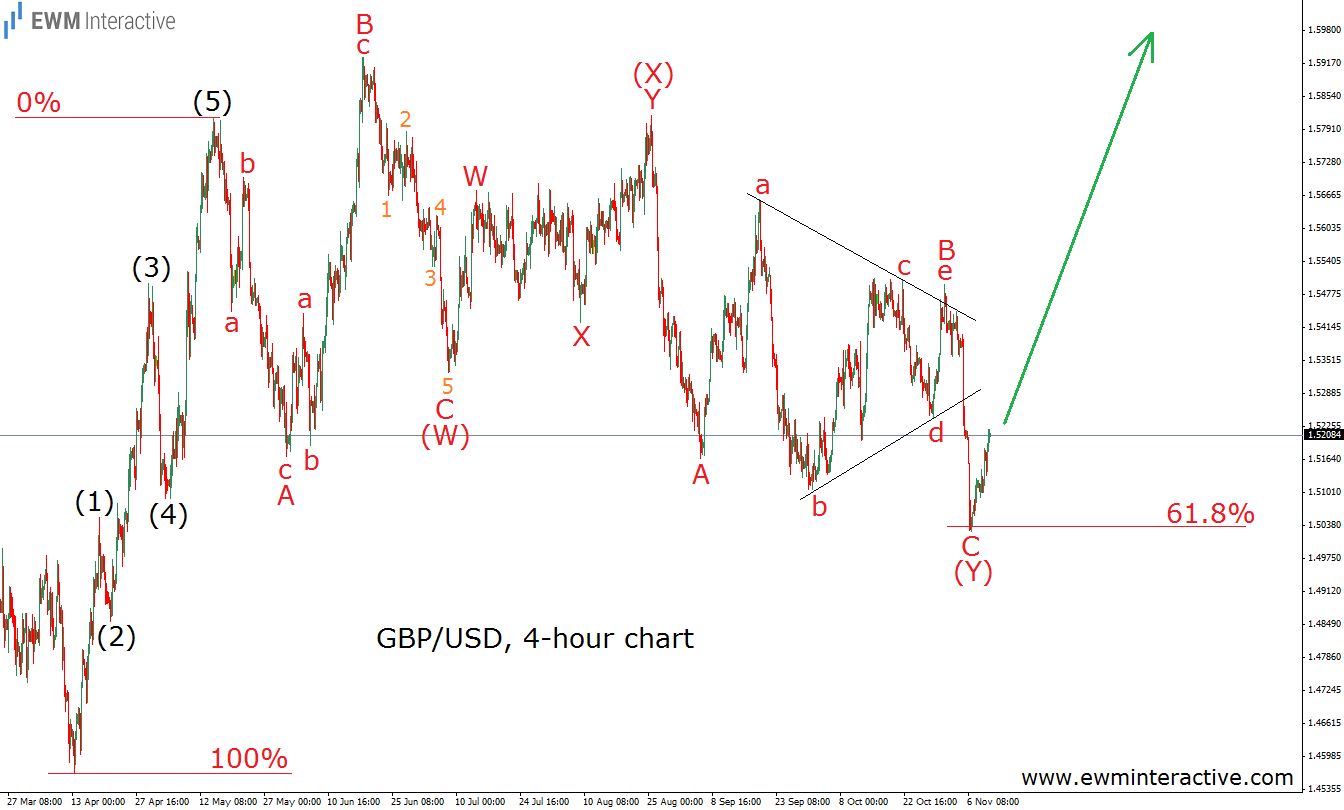
GBP/USD has been very slow and choppy since the middle of May. A strong move to the upside was always followed by an equally impressive decline. Typically, this is how corrections behave. However, it looks like the retracement is finally over. Let’s apply the Elliott Wave Principle to the 4-hour chart of GBP/USD and see if we could support this claim.
In “How To Read A Corrective Combination”, we used USD/JPY to show you an example of a complex correction, consisting of a double zig-zag in wave W, another one in X and a triangle in Y. In other words, corrective combinations are made of at least two types of corrective patterns with an X wave in between. This is exactly what we believe has been developing in GBP/USD during the last six months.
As the chart shows, the recovery from 1.4565 to 1.5815, which took place between April 13th and May 14th, cold be counted as a five-wave impulse. According to the theory, every impulse is followed by a correction in the opposite direction. In this case, the correction appears to be a (W)-(X)-(Y), where wave (W) is a running flat, wave (X) is a double zig-zag and wave (Y) is a simple A-B-C zig-zag with a triangle for wave B. What is more interesting is that this complex correction seems to have ended precisely at the 61.8% Fibonacci retracement level. If this is the correct count, the 5-3 wave cycle is already over. This means the trend is supposed to continue in the direction of the impulsive sequence. In the long term, the bulls’ gains might extend to 1.60 or even higher.
Which stock should you buy in your very next trade?
AI computing powers are changing the stock market. Investing.com's ProPicks AI includes 6 winning stock portfolios chosen by our advanced AI. In 2024 alone, ProPicks AI identified 2 stocks that surged over 150%, 4 additional stocks that leaped over 30%, and 3 more that climbed over 25%. Which stock will be the next to soar?
Unlock ProPicks AI