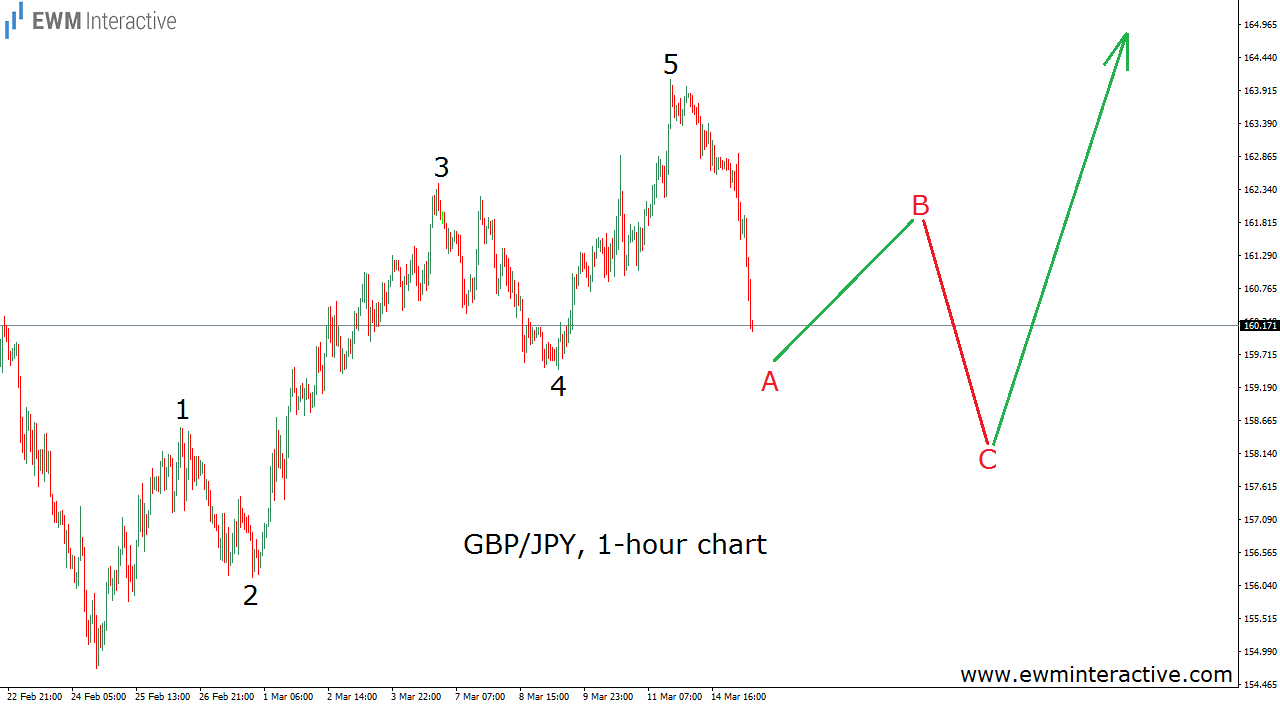
GBP/JPY bottomed at 154.70 on February 24th and managed to recover to 164.10, when the bears returned. The pair is currently trading slightly above 160.10, but what could we expect from now on? Is this just a pull-back or the resumption of the larger downtrend? The Elliott Wave Principle might help us find the answer. It is applied to the hourly chart of GBP/JPY, given below.

As visible, the advance between 154.70 and 164.10 could be counted as a five-wave impulse, which means the trend’s direction, at least in the short-term, has changed to the north. The theory says that every impulse is followed by a three-wave correction in the opposite direction, before the trend continues. That is what we believe the current weakness is – wave A of a three-wave A-B-C retracement. If this is the correct count, GBP/JPY still needs to make wave B up and C down, in order to complete the corrective pull-back.
After that, the bulls should finally return and take the exchange rate above the top of wave 5 at 164.10. This scenario would be invalidated if GBP/JPY falls below the start of the impulsive sequence at 154.70. As long as it holds, the bulls remain in the driving seat.
Which stock should you buy in your very next trade?
With valuations skyrocketing in 2024, many investors are uneasy putting more money into stocks. Unsure where to invest next? Get access to our proven portfolios and discover high-potential opportunities.
In 2024 alone, ProPicks AI identified 2 stocks that surged over 150%, 4 additional stocks that leaped over 30%, and 3 more that climbed over 25%. That's an impressive track record.
With portfolios tailored for Dow stocks, S&P stocks, Tech stocks, and Mid Cap stocks, you can explore various wealth-building strategies.
