Bitcoin price today: rises past $120k as US House passes key crypto bills
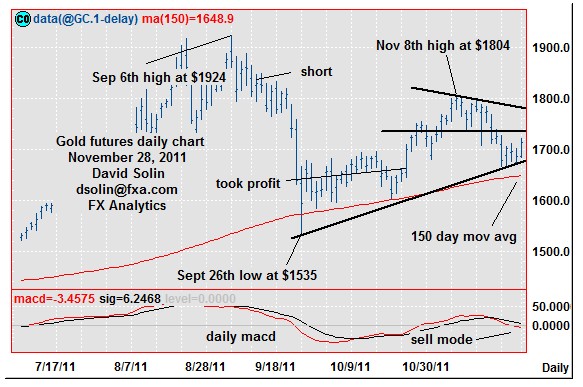
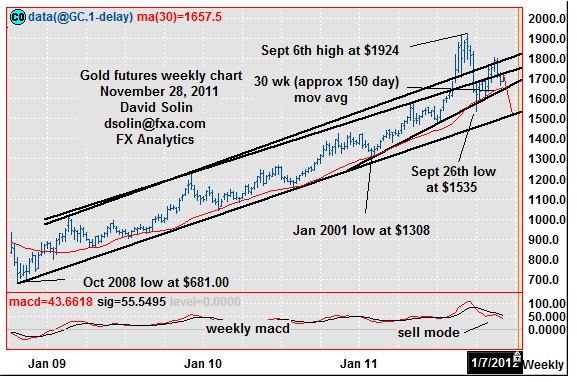
Gold is trading near the middle of the $1535/1924 range that has been in place since early Sept. Broadly seen as an extended period of consolidating, with declines back to the base and eventually below. Note too that the daily macd remains in sell mode (see bottom of daily chart below), while the nearer term downside pattern from the Nov 8th high at $1804 is not yen "complete" (see shorter term chart at http://www.fxa.com/solin/comments.htm ), and in turn suggests at least some downside may be directly ahead. So for now, want to be short and would sell here (currently at $1715) for the $1535 low and below. Initially use a wide stop on a close above the bearish trendline from the early Nov (currently at $1782/85), but getting much more aggressive on a close below the key 150 day moving average (has held numerous times nearly perfectly over the last 2 1/2 years, see weekly chart/2nd chart below) as there is some risk for a more extended period of wide ranging (another few weeks/month), before the new lows are seen. Support before there is seen at the bullish trendline from late Sept (currently at $1672/75), while nearby resistance is seen at $1734/37.
Longer term as mentioned above, another downleg back to the Sept 26th low at $1535 and even below is favored. Note too that the market may have completed the whole upmove from at least the Oct 2008 low at $681, and would raise the potential for declines below $1535, to the base of the multi-year bullish channel (currently at $1500/10), $1450/60 (38% retracement from the $ 681 low) and potentially below. Also remain very bearish out the next 9-12 months on most "risk" markets, and generally view gold in that category. Note that when broader asset markets selloff sharply, gold will sometimes get a bit of a bid initially on safe haven buying, but often "catches up" on the downside soon after. So for now, would maintain the longer term bearish bias that was put in place on Oct 13th at $1668. But will be watching closely for more info in regards to the magnitude of the bigger picture decline on a break below the $1535 low.


Longer term as mentioned above, another downleg back to the Sept 26th low at $1535 and even below is favored. Note too that the market may have completed the whole upmove from at least the Oct 2008 low at $681, and would raise the potential for declines below $1535, to the base of the multi-year bullish channel (currently at $1500/10), $1450/60 (38% retracement from the $ 681 low) and potentially below. Also remain very bearish out the next 9-12 months on most "risk" markets, and generally view gold in that category. Note that when broader asset markets selloff sharply, gold will sometimes get a bit of a bid initially on safe haven buying, but often "catches up" on the downside soon after. So for now, would maintain the longer term bearish bias that was put in place on Oct 13th at $1668. But will be watching closely for more info in regards to the magnitude of the bigger picture decline on a break below the $1535 low.
3rd party Ad. Not an offer or recommendation by Investing.com. See disclosure here or remove ads.


Which stock should you buy in your very next trade?
AI computing powers are changing the stock market. Investing.com's ProPicks AI includes 6 winning stock portfolios chosen by our advanced AI. In 2024 alone, ProPicks AI identified 2 stocks that surged over 150%, 4 additional stocks that leaped over 30%, and 3 more that climbed over 25%. Which stock will be the next to soar?
Unlock ProPicks AI