Nvidia to resume H20 chip sales in China, announces new processor
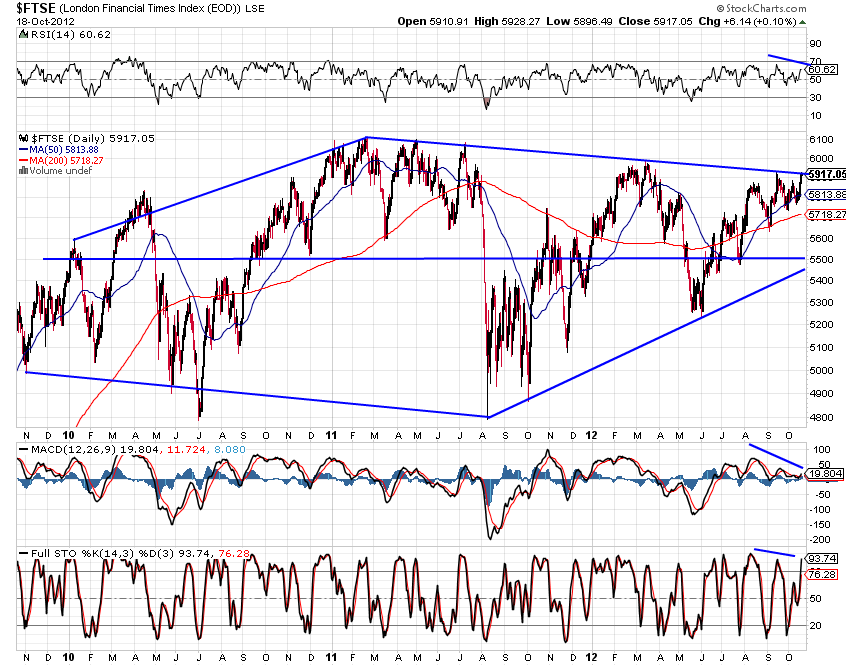
In my post of July 25th, I pointed out that Britain's FTSE 100 Index was trading around a major price support/resistance level of 5500. It subsequently bounced from there and has risen to the top of the large "Diamond" pattern (which, I mentioned, has been forming from 2009/10...and is, potentially, a topping pattern with a 1300 point range).
The updated Daily chart below shows market action, to date (October 18th's close). Price is facing immediate major headwind resistance from the upper edge of this Diamond pattern, along with negatively-diverging RSI, MACD, and Stochastics Indicators...one to watch for a potential breakdown, as the 1300 point range is substantial.
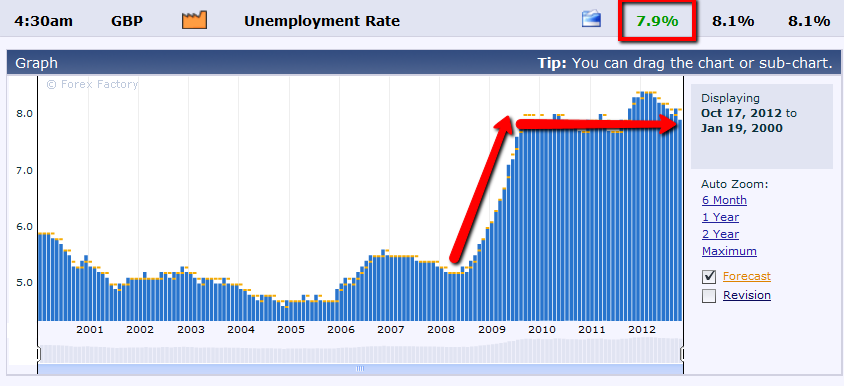
I'm mindful of the fact that Britain is also facing a 9 billion pound debt incurred from hosting the 2012 Olympic Games, as it struggles with a double-dip recession, severe public spending cuts, and an unemployment rate of 7.9% (as reported here on October 17th and shown on the graph below)...adding, enormously, to the above headwinds.
Which stock should you buy in your very next trade?
AI computing powers are changing the stock market. Investing.com's ProPicks AI includes 6 winning stock portfolios chosen by our advanced AI. In 2024 alone, ProPicks AI identified 2 stocks that surged over 150%, 4 additional stocks that leaped over 30%, and 3 more that climbed over 25%. Which stock will be the next to soar?
Unlock ProPicks AI