Bitcoin price today: slips to $117.9k amid muted sentiment; remains rangebound
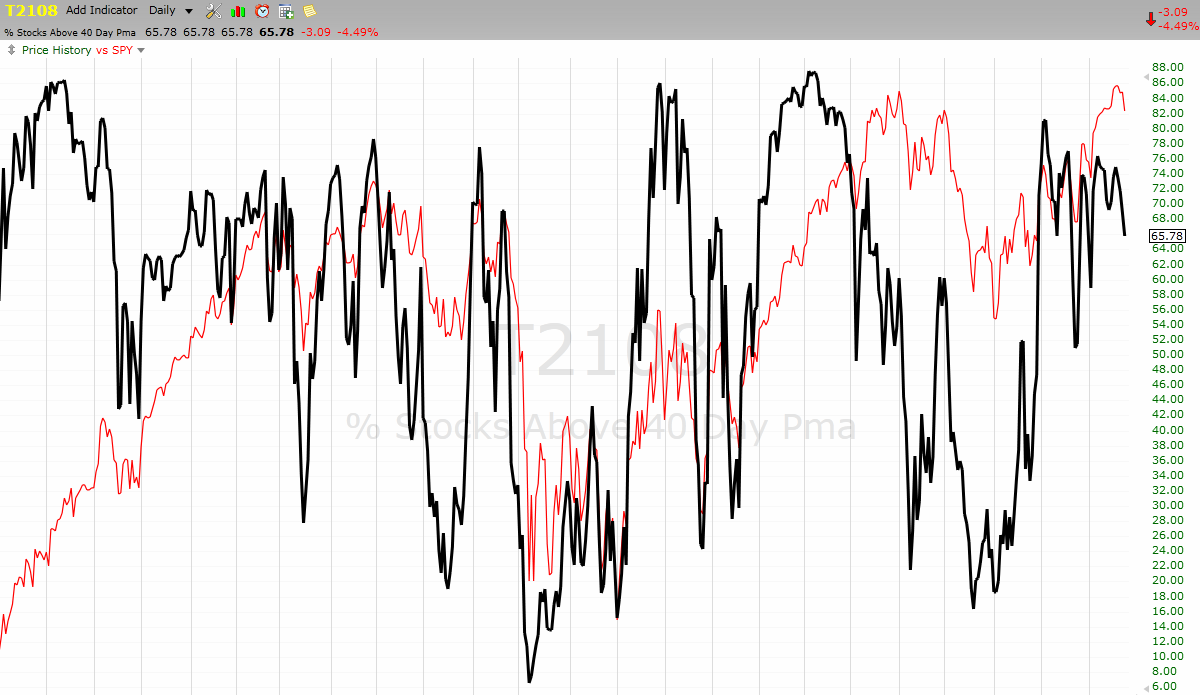
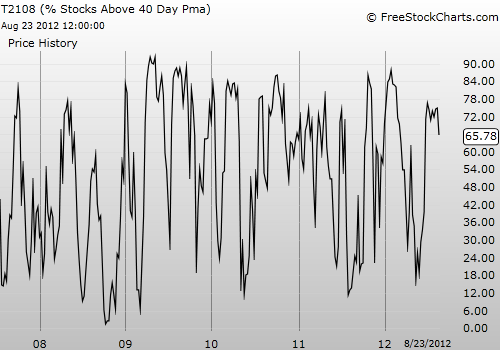
T2108 Status: 65.8%
VIX Status: 16.0
General (Short-term) Trading Call: Lock in some profits on longs otherwise hold (assuming bearish positions already in place). Trading bias goes to the bears.
Commentary
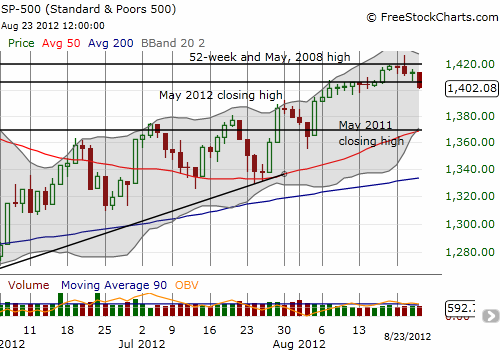
On Tuesday, August 21, I warned about a potential topping pattern as the S&P 500 faded from multi-year highs to end the day lower. Today, we received confirmation of the top with the index punching through its first line of natural support, the May highs from this year.

The last overbought period ended with August 21st’s fakeout. It lasted five days and produced a slight gain. On the next day, I immediately loaded up a first tranche of puts on SSO when the index went lower. Technically, I should have waited until the close, but I was also wary that the index could sell-off sharply. I completely neglected to take into consideration the release of the minutes of the last Federal Reserve meeting. The “excitement” over that release was enough to keep a flat close on the S&P 500. The true follow-through selling occurred today with a 0.8% loss. (See “Federal Reserve Minutes Renew Pressure On Japanese Yen” for more of my thoughts on implications).
For now, trading is easier for the bears. The HUGE onus is on the buyers to prove that the market’s rally still has steam. Until buying momentum returns, I think the index is susceptible to a swift, multi-day sell-off at any time. Bears have an easy stopping point which is a fresh CLOSE above the intra-day high from two days ago. Until that happens, AND the index follows through, the bias is to fade rallies, especially at natural resistance.
Having said that, recall that the intermediate-term bias remains bullish until the S&P 500 manages to print a lower low. That has happened since the June lows.
Daily T2108 vs the S&P 500
Click chart for extended view with S&P 500 fully scaled vertically (updated at least once a week)

Black line: T2108 (measured on the right); Green line: S&P 500 (for comparative purposes)

Be careful out there!
Full disclosure: long SSO puts
VIX Status: 16.0
General (Short-term) Trading Call: Lock in some profits on longs otherwise hold (assuming bearish positions already in place). Trading bias goes to the bears.
Commentary
On Tuesday, August 21, I warned about a potential topping pattern as the S&P 500 faded from multi-year highs to end the day lower. Today, we received confirmation of the top with the index punching through its first line of natural support, the May highs from this year.

The last overbought period ended with August 21st’s fakeout. It lasted five days and produced a slight gain. On the next day, I immediately loaded up a first tranche of puts on SSO when the index went lower. Technically, I should have waited until the close, but I was also wary that the index could sell-off sharply. I completely neglected to take into consideration the release of the minutes of the last Federal Reserve meeting. The “excitement” over that release was enough to keep a flat close on the S&P 500. The true follow-through selling occurred today with a 0.8% loss. (See “Federal Reserve Minutes Renew Pressure On Japanese Yen” for more of my thoughts on implications).
For now, trading is easier for the bears. The HUGE onus is on the buyers to prove that the market’s rally still has steam. Until buying momentum returns, I think the index is susceptible to a swift, multi-day sell-off at any time. Bears have an easy stopping point which is a fresh CLOSE above the intra-day high from two days ago. Until that happens, AND the index follows through, the bias is to fade rallies, especially at natural resistance.
3rd party Ad. Not an offer or recommendation by Investing.com. See disclosure here or remove ads.
Having said that, recall that the intermediate-term bias remains bullish until the S&P 500 manages to print a lower low. That has happened since the June lows.
Daily T2108 vs the S&P 500
Click chart for extended view with S&P 500 fully scaled vertically (updated at least once a week)

Black line: T2108 (measured on the right); Green line: S&P 500 (for comparative purposes)

Be careful out there!
Full disclosure: long SSO puts
Which stock should you buy in your very next trade?
AI computing powers are changing the stock market. Investing.com's ProPicks AI includes 6 winning stock portfolios chosen by our advanced AI. In 2024 alone, ProPicks AI identified 2 stocks that surged over 150%, 4 additional stocks that leaped over 30%, and 3 more that climbed over 25%. Which stock will be the next to soar?
Unlock ProPicks AI