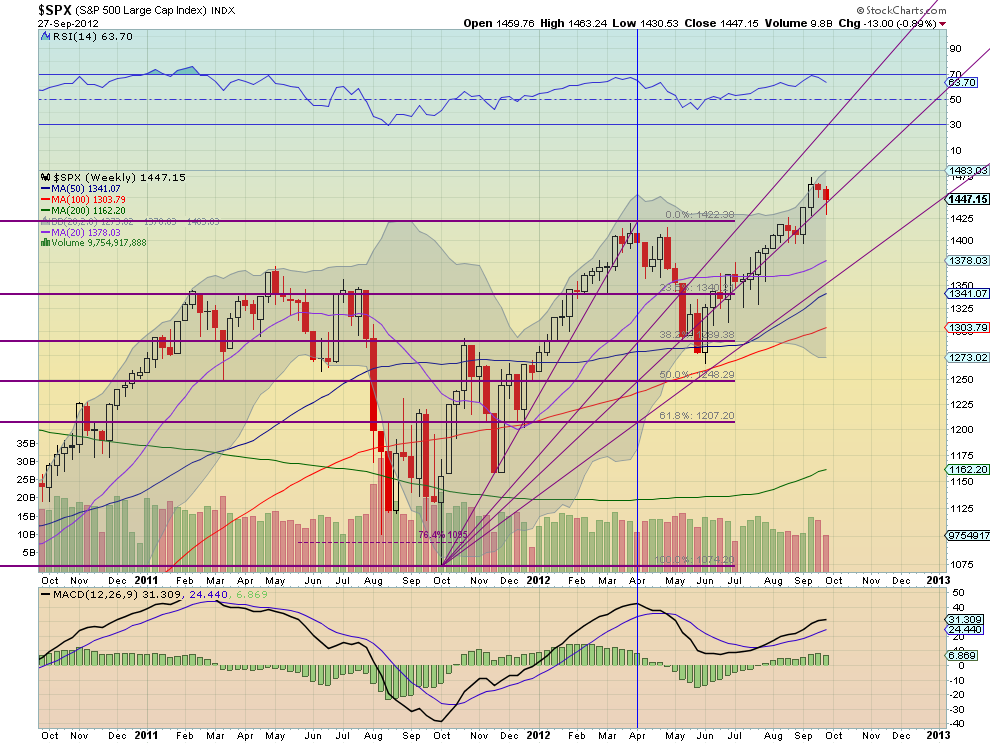
This weekly chart below shows the price action of the S&P 500 over the last two years. Following a move higher from the October 2011 lows to the April 2012 highs, SPX pulled back and is now riding the middle-trend line higher. But that line goes back to the October 2011 low, which makes it what? A Fibonacci Fan line.
These Fans are drawn by creating lines from the previous low rising up through the point where the key Fibonacci levels -- 38.2%, 50% and 61.8% -- meet the vertical line dropped from the previous high (in blue, here). These measure the extent of the pullback in terms of how fast it's moving, and so are also known as 'Speed Lines'. They are important because they can often act as support or a reversal point. In this case the 50% Fan Line has been good support, with only a brief one-candle dip below it that was immediately erased the next week.
The information in this blog post represents my own opinions and does not contain a recommendation for any particular security or investment. I or my affiliates may hold positions or other interests in securities mentioned in the Blog, please see my Disclaimer page for my full disclaimer.
Original post
Which stock should you buy in your very next trade?
AI computing powers are changing the stock market. Investing.com's ProPicks AI includes 6 winning stock portfolios chosen by our advanced AI. In 2024 alone, ProPicks AI identified 2 stocks that surged over 150%, 4 additional stocks that leaped over 30%, and 3 more that climbed over 25%. Which stock will be the next to soar?
Unlock ProPicks AI