It’s long been established that stock market returns aren’t normally distributed and that fat tails (extreme returns that are unexpected for a normal distribution) apply. This has implications, of course, for portfolio design and management. The first question: What are the choices for managing tail risk for equity exposures? There are many answers, each with a different set of pros and cons. Perhaps the first choice to consider: focus on longer-term results and look through the shorter-term noise. Is this a viable risk-management strategy? Let’s take a look at the data for insight.
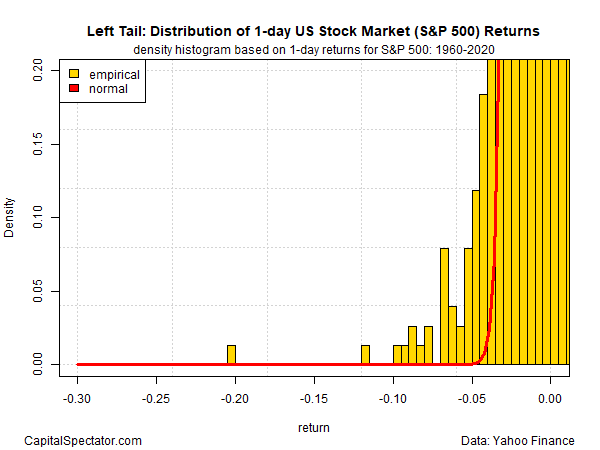
Consider the S&P 500 index since 1950, as we zoom in on the extreme left-hand tail of the distribution in the chart below. It’s clear that one-day returns exhibit quite a lot of relatively steep negative returns — a frequency that’s above and beyond what a normal distribution anticipates (as indicated by the gold bars rising above the red line, which indicates a normal distribution).

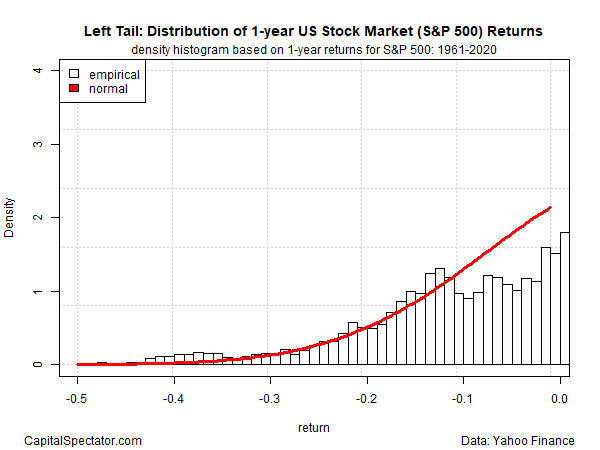
For strategic-minded investors, however, one-day results are meaningless and so they can be ignored. How does the distribution change for longer-term results? Let’s start with 1-year performance. As the next chart below shows, however, fat-tail risk still inhabits one-year results. Notably, 1-year losses deeper than -30% show up in the historical record with a conspicuously higher frequency than expected for a normal distribution. The lesson: a one-year return focus doesn’t offer relief from fat-tail risk.
10-year vs 1-year performance
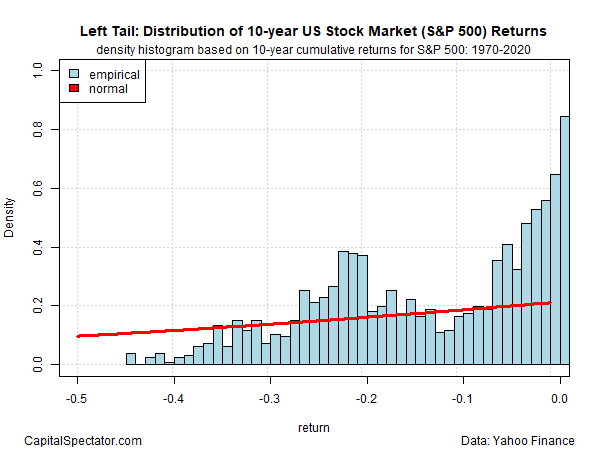
How does a 10-year focus compare? Alas, there’s no escape on this front either. Since 1970, the numbers show that extreme 10-year returns (based on cumulative results) have a habit of arising more often than you’d predict with a normal-distribution model.

To be fair, negative returns generally become less probable as time horizon lengthens, or so the history for US stocks implies. But that’s a different issue from estimating the likelihood that we’ll see an extreme 10-year loss from the perspective of a normal-distribution-informed probability. The main takeaway: even at a 10-year horizon, a normal-distribution model will lead you astray and so you’ll need a different analytical toolkit to estimate what the future is likely to dispense.
Overall, the analytics above also show that lengthening time horizon isn’t an effective tool for managing tail risk for equity allocations. What does work? We’ll explore some of the options in the next round of articles.
Which stock should you buy in your very next trade?
With valuations skyrocketing in 2024, many investors are uneasy putting more money into stocks. Unsure where to invest next? Get access to our proven portfolios and discover high-potential opportunities.
In 2024 alone, ProPicks AI identified 2 stocks that surged over 150%, 4 additional stocks that leaped over 30%, and 3 more that climbed over 25%. That's an impressive track record.
With portfolios tailored for Dow stocks, S&P stocks, Tech stocks, and Mid Cap stocks, you can explore various wealth-building strategies.

