Research Highlights
- The washout-low price move in FANG stocks may present a needed rotation in price before another upside move sets up.
- Tweezer Bottoms pattern and RSI pennant formation suggest very clear support levels.
- Watch how volume and the VIX pick up over the next few days, and how price reacts to this bounce at 945.
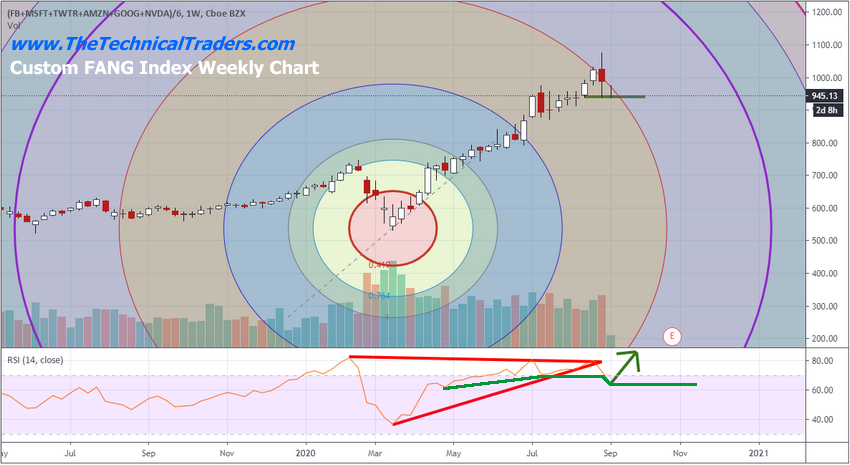
Our Custom FANG Index (consisting of Facebook (NASDAQ:FB), Microsoft (NASDAQ:MSFT), Twitter, Amazon (NASDAQ:AMZN), Google (NASDAQ:GOOGL) and Nvidia (NASDAQ:NVDA)) shows the FANG Index, and technology sector, are trading just above critical support near 945. The congestion area on this chart between July and August just below this 945 level highlights the key resistance/support level that we are currently watching as price support.
Tweezer Bottoms May Suggest More Upside Potential
This Custom FANG Index Weekly chart clearly slows the Tweezer Bottoms pattern that formed in the markets after the close on Tuesday, Sept. 8. This pattern suggests a very clear support level is found near the recent lows – near 945. If this support level holds, then the FANG Index price should begin to bounce and move higher. If this support level is broken, prices may continue to push lower while attempting to find historical support levels.
The Fibonacci Price Amplitude Arcs suggest a broader price frequency inflection point is also setting up near the recent peak. This Fibonacci Price Amplitude Arc suggests a major inflection point is taking place in the Custom FANG index right now. We believe the 945 level resulting from the Tweezer Bottoms pattern is a critical price level to support a future price rally in this sector.
Lastly, we want to point out the pennant/flag formation in the RSI indicator over the past 8+ months (highlighted in RED). The combination of these technical patterns, as well as the new Tweezer Bottoms pattern, suggests the current breakdown to the 945 level may present a “washout-low” type rotation after the RSI Pennant Apex. Overall, this downside move in the FANG index represents a moderately strong APEX rotation. If this is a “washout” rotation, then we may be setting up for another big upside price move soon.

Right now, we are cautiously watching the 945 level and expecting the Custom FANG Index to recover from these Tweezer Bottoms lows. We believe there is a very solid chance that the washout-low price move may present a needed rotation in price before another upside move sets up.
Which stock should you buy in your very next trade?
AI computing powers are changing the stock market. Investing.com's ProPicks AI includes 6 winning stock portfolios chosen by our advanced AI. In 2024 alone, ProPicks AI identified 2 stocks that surged over 150%, 4 additional stocks that leaped over 30%, and 3 more that climbed over 25%. Which stock will be the next to soar?
Unlock ProPicks AI
