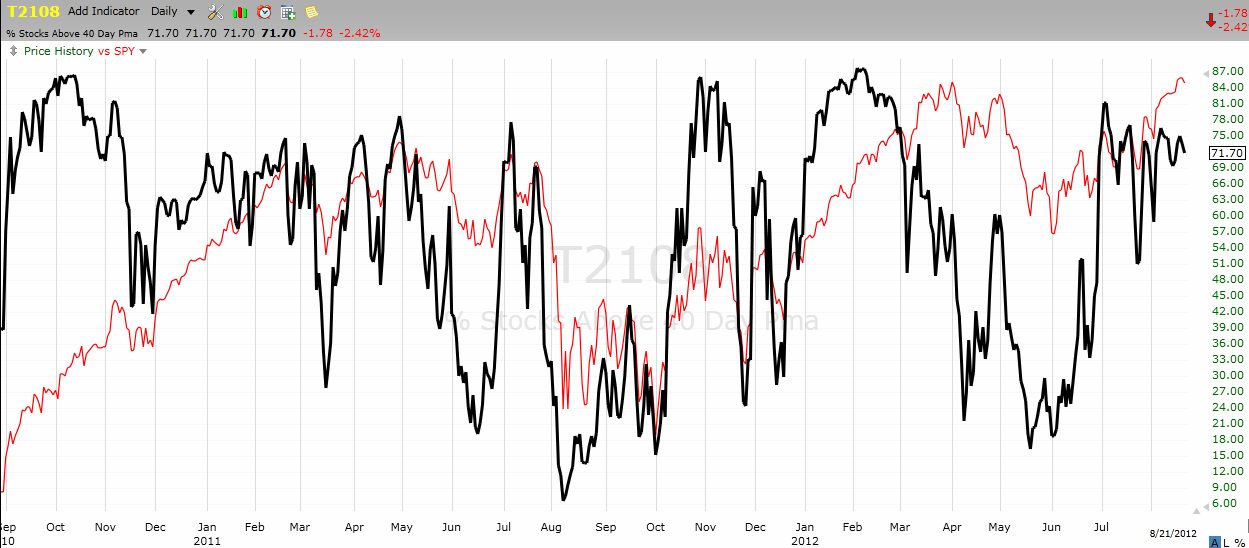
T2108 Status: 71.7% (fifth day of fifth overbought period since June 29).
VIX Status: 15.0
General (Short-Term) Trading Call: Start or add to bearish position on lower S&P 500. Otherwise hold.
Commentary
This picture should set off alarm bells with every and any technician paying attention:
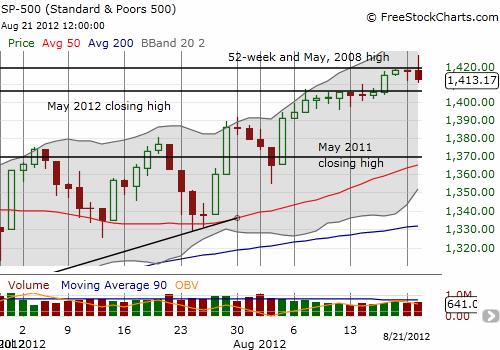
This false breakout – where the S&P 500 surged to new 52-week and 4+ year highs only to close below the breakout point the same day – is a stark reminder of why traders wait for confirmation of major moves. Let the market prove that it is strong (or weak as the case may be). Now, this bearish pattern opens up the opportunity to go short with a tight stop at fresh highs. T2108 is still overbought, so I am well within the rules to initiate fresh bearish positions (with SSO puts). Moreover, stochastics are VERY overbought right now.
The day’s fade also produced similar fades across many individual stocks. Those that faded at recognizable resistance levels will be particularly vulnerable to swift selling as traders rush to take profits before they get taken away in September’s seasonal weakness.
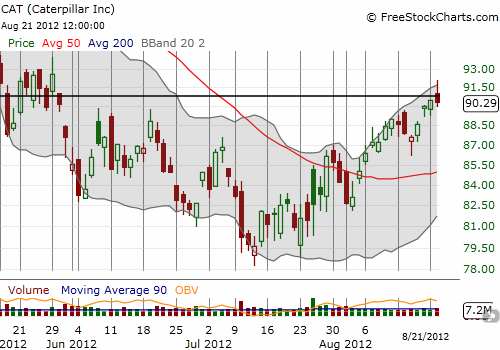
Caterpillar (CAT), my canary in the coal mine, faded right at breakeven for the year. I consider this confirmation of the increased downside risk. CAT is also an example of a good (swing trade) shorting candidate: short on a break below Tuesday’s low and stop out, if needed, at the highs of Tuesday. An even better candidate would be a stock below BOTH its 50 and 200DMAs.
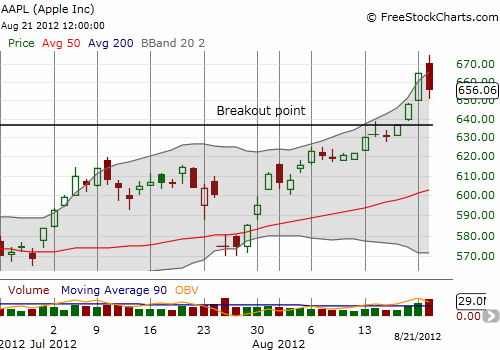
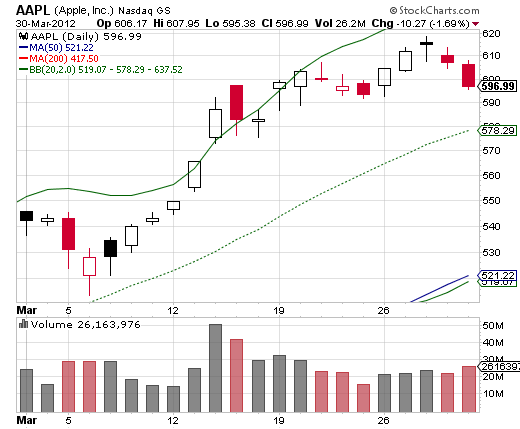
I also looked to Apple (AAPL) for clues given its strong and impressive breakout over the last two days. Today, Apple broke down along with the market, but it did NOT break the lows from Monday. While it broke out to new all-time highs only to fade backwards on high volume, it is a tad early to get bearish. In fact, Apple could actually represent a sliver of hope that buyers and bulls can collect themselves fast enough before this fade turns into a full-out correction. There is every possibility Tuesday’s pull-back will be similar to March 15th’s pullback. At that time, it surely felt like Apple had finally topped out – exactly one month after Apple printed a classic topping pattern.
The next three important things to watch as signs of follow-through weakness: 1) first a break of Monday’s low, 2) then a break of the primary uptrend, 3) and finally a drop and a close BELOW the breakout point (around $636). If Apple retests the breakout point, I am expecting the line to survive the test.
Daily T2108 Vs. The S&P 500
Click chart for extended view with S&P 500 fully scaled vertically:
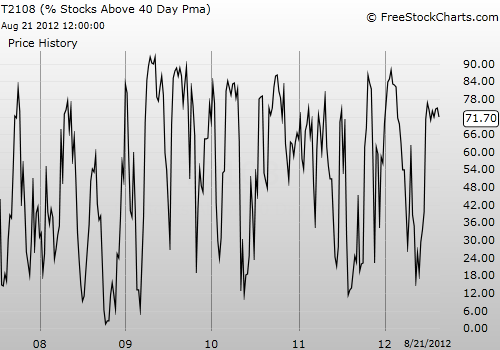
Weekly T2108
Be careful out there!
Full disclosure: Long AAPL calls, long CAT.
VIX Status: 15.0
General (Short-Term) Trading Call: Start or add to bearish position on lower S&P 500. Otherwise hold.
Commentary
This picture should set off alarm bells with every and any technician paying attention:

This false breakout – where the S&P 500 surged to new 52-week and 4+ year highs only to close below the breakout point the same day – is a stark reminder of why traders wait for confirmation of major moves. Let the market prove that it is strong (or weak as the case may be). Now, this bearish pattern opens up the opportunity to go short with a tight stop at fresh highs. T2108 is still overbought, so I am well within the rules to initiate fresh bearish positions (with SSO puts). Moreover, stochastics are VERY overbought right now.
The day’s fade also produced similar fades across many individual stocks. Those that faded at recognizable resistance levels will be particularly vulnerable to swift selling as traders rush to take profits before they get taken away in September’s seasonal weakness.
Caterpillar (CAT), my canary in the coal mine, faded right at breakeven for the year. I consider this confirmation of the increased downside risk. CAT is also an example of a good (swing trade) shorting candidate: short on a break below Tuesday’s low and stop out, if needed, at the highs of Tuesday. An even better candidate would be a stock below BOTH its 50 and 200DMAs.
3rd party Ad. Not an offer or recommendation by Investing.com. See disclosure here or remove ads.

I also looked to Apple (AAPL) for clues given its strong and impressive breakout over the last two days. Today, Apple broke down along with the market, but it did NOT break the lows from Monday. While it broke out to new all-time highs only to fade backwards on high volume, it is a tad early to get bearish. In fact, Apple could actually represent a sliver of hope that buyers and bulls can collect themselves fast enough before this fade turns into a full-out correction. There is every possibility Tuesday’s pull-back will be similar to March 15th’s pullback. At that time, it surely felt like Apple had finally topped out – exactly one month after Apple printed a classic topping pattern.
The next three important things to watch as signs of follow-through weakness: 1) first a break of Monday’s low, 2) then a break of the primary uptrend, 3) and finally a drop and a close BELOW the breakout point (around $636). If Apple retests the breakout point, I am expecting the line to survive the test.


Daily T2108 Vs. The S&P 500
Click chart for extended view with S&P 500 fully scaled vertically:

Weekly T2108

Be careful out there!
Full disclosure: Long AAPL calls, long CAT.
Which stock should you buy in your very next trade?
AI computing powers are changing the stock market. Investing.com's ProPicks AI includes 6 winning stock portfolios chosen by our advanced AI. In 2024 alone, ProPicks AI identified 2 stocks that surged over 150%, 4 additional stocks that leaped over 30%, and 3 more that climbed over 25%. Which stock will be the next to soar?
Unlock ProPicks AI