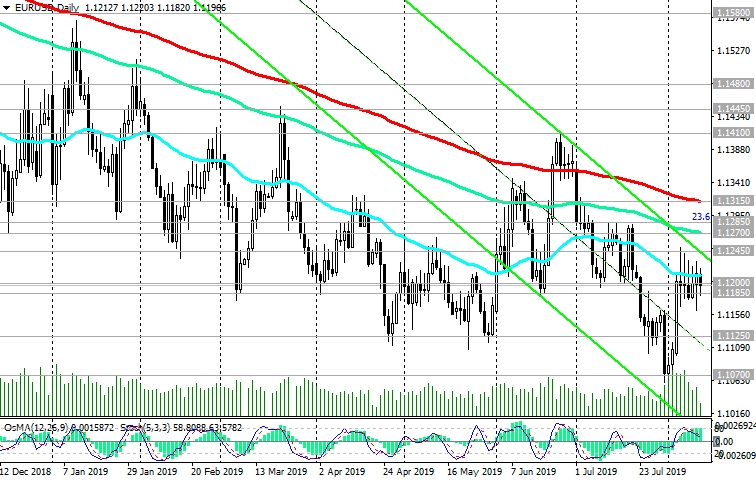
After the ECB signaled in July that it was ready to soften its monetary policy, EUR/USD hit a new annual low near 1.1100, but then adjusted to current levels.
Since the opening of today's trading day, the EUR/USD has moderately decreased, while continuing to trade in the range near the short-term support level of 1.1185 (ЕМА200 on the 1-hour chart) and short-term resistance level of 1.1200 (ЕМА200 on the 4-hour chart).
Expectations of further easing of the monetary policy of the ECB put pressure on the euro and the pair EUR/USD. It is likely that at the ECB meeting on September 12 a whole package of measures will be taken, including a 0.25% reduction in the interest rate and a restart of the quantitative easing program worth 2.6 trillion euros.
At the same time, despite Trump's criticism of the Fed and its monetary policy, and the expectation of a Fed rate cut, the dollar continues to be in demand among investors.
Underestimated risks that the UK will leave the European Union on October 31 without any agreement on Brexit, political and economic differences within Eurozone, as well as the accelerating devaluation of national currencies in a number of countries (at the beginning of the month there are three central banks at once - India, Thailand, New Zealand - reduced interest rates), only add the negative in relation to the mood of the business.
Investors are concerned about the escalation of the trade conflict between the US and China (from September 1, the US is expected to introduce new 10% import duties on Chinese goods). On the other hand, the American economy looks more stable in comparison with other major world economies and continues to grow, which causes an influx of investment in American assets and the dollar.
Below the resistance levels 1.1315 (ЕМА200 on the daily chart), 1.1285 (Fibonacci level 23.6% of the correction to the fall from the level of 1.3900, which began in May 2014), long-term negative dynamics persist.
An upward correction is also possible, but so far no higher than the resistance levels of 1.1245 (the upper line of the descending channel on the daily chart and the highs of August), 1.1270 (ЕМА144 on the daily chart).
Support Levels: 1.1185, 1.1125, 1.1070, 1.1000
Resistance Levels: 1.1200, 1.1245, 1.1270, 1.1285, 1.1315
Trading Recommendations
Sell by market. Stop-Loss 1.1250. Take-Profit 1.1125, 1.1070, 1.1000
Buy Stop 1.1250. Stop-Loss 1.1190. Take-Profit 1.1270, 1.1285, 1.1315

Which stock should you buy in your very next trade?
With valuations skyrocketing in 2024, many investors are uneasy putting more money into stocks. Unsure where to invest next? Get access to our proven portfolios and discover high-potential opportunities.
In 2024 alone, ProPicks AI identified 2 stocks that surged over 150%, 4 additional stocks that leaped over 30%, and 3 more that climbed over 25%. That's an impressive track record.
With portfolios tailored for Dow stocks, S&P stocks, Tech stocks, and Mid Cap stocks, you can explore various wealth-building strategies.

