The common currency which opened Monday on a weaker note was seen attempting to pare losses. The declines in the currency pair came as investors remained hopeful that Trump will push through with his proposed tax reforms. Rumors that the President will be nominating a new Fed Chair also sent investors optimistic on the US dollar.
On the economic front, data was quiet yesterday. Politics remained at the forefront with investors digesting the weekend victory of Abe and the ongoing political turmoil from Spain. The kiwi dollar was seen coming under pressure yet again as the coalition details between the Labor party and the NZ First Party was released.
Looking ahead, the economic calendar today will be dominated by data from the Eurozone. Flash manufacturing and services PMI numbers are expected to be released. In the US the Markit's flash manufacturing and services PMI numbers for October will also be coming out.
EUR/USD Intraday Analysis

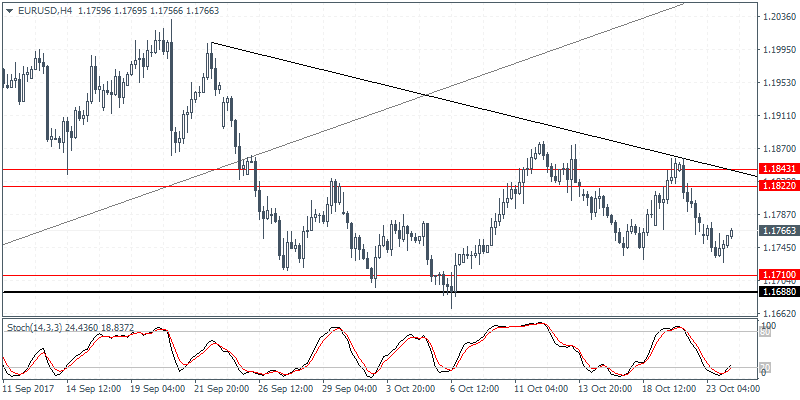
EUR/USD (1.1766): The EUR/USD price action was subdued yesterday with the market confined to a small range. The currency pair is seen posting a modest recovery in the early trading session today. We could expect the upside momentum to continue towards filling the Friday's close at 1.1776. The bias is likely to remain sideways into this Thursday's ECB meeting although we expect EUR/USD to touch down towards the 1.1710 level of support. This would mark a strong retest of this support although price action will need to break to the downside to extend further declines. To the upside, the common currency will be facing the test of resistance at 1.1822.
USD/JPY Intraday Analysis

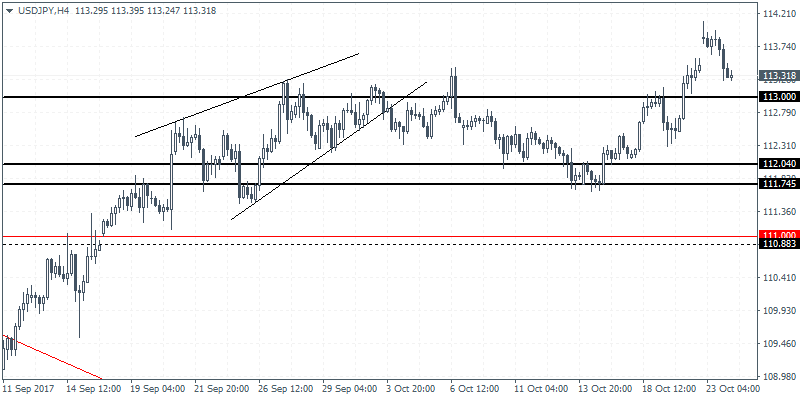
USD/JPY (113.31): The USD/JPY gapped higher yesterday, but price action was seen pushing lower. The bearish close yesterday suggests some downside momentum. Support in USD/JPY is seen at 113.00 level which previously served as resistance. Establishing support at 113.00 level will suggest a near term bounce to the upside. However, USD/JPY will need to breakout above the previous highs established near 114.00 to extend further gains. The risk of a close below 113.00 is possible. This could push USD/JPY back into the range of 113.00 and 111.74.
XAU/USD Intraday Analysis

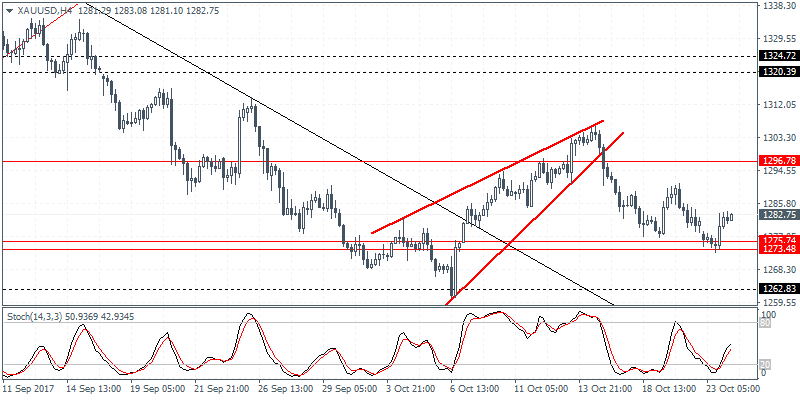
XAU/USD (1282.75): Gold prices maintained the gains yesterday following the decline to the support level at 1275 - 1274 level. In the short term, gold prices might remain supported above this level as price attempts to test the upper resistance near the 1296.50 level. Further gains in gold can be expected on a convincing close above 1296.50 level. In this case, gold prices could be aiming for the 1320 - 1324 level where the next main resistance level resides. To the downside, a breakdown below 1275 - 1274 support will send gold prices lower towards the 1262 handle.
