

And finally to the euro index which continues to wallow in a sea of misery, as both politics and fundamental news continue to batter and buffet the single currency on a daily basis. The latest political news to impact the euro is this morning’s surprise announcement of a snap general election in the UK in June, and should the polls prove to be correct, likely to give the UK government the mandate it needs to drive through Britain’s exit from Europe and leave the euro more exposed than before.
From a technical perspective it is interesting to consider the euro over a spread of timeframes which reinforces the current malaise for the currency, and the complete lack of direction in the longer term. And if we start with the monthly chart two things are self evident. First, the volatility associated with the price action over the last two years is a classic example of volatility with no trend denoting wild swings in sentiment on the daily and weekly timeframes, but with no direction in terms of the monthly chart which continues to consolidate between 118.80 to the downside and 126.50 to the upside.
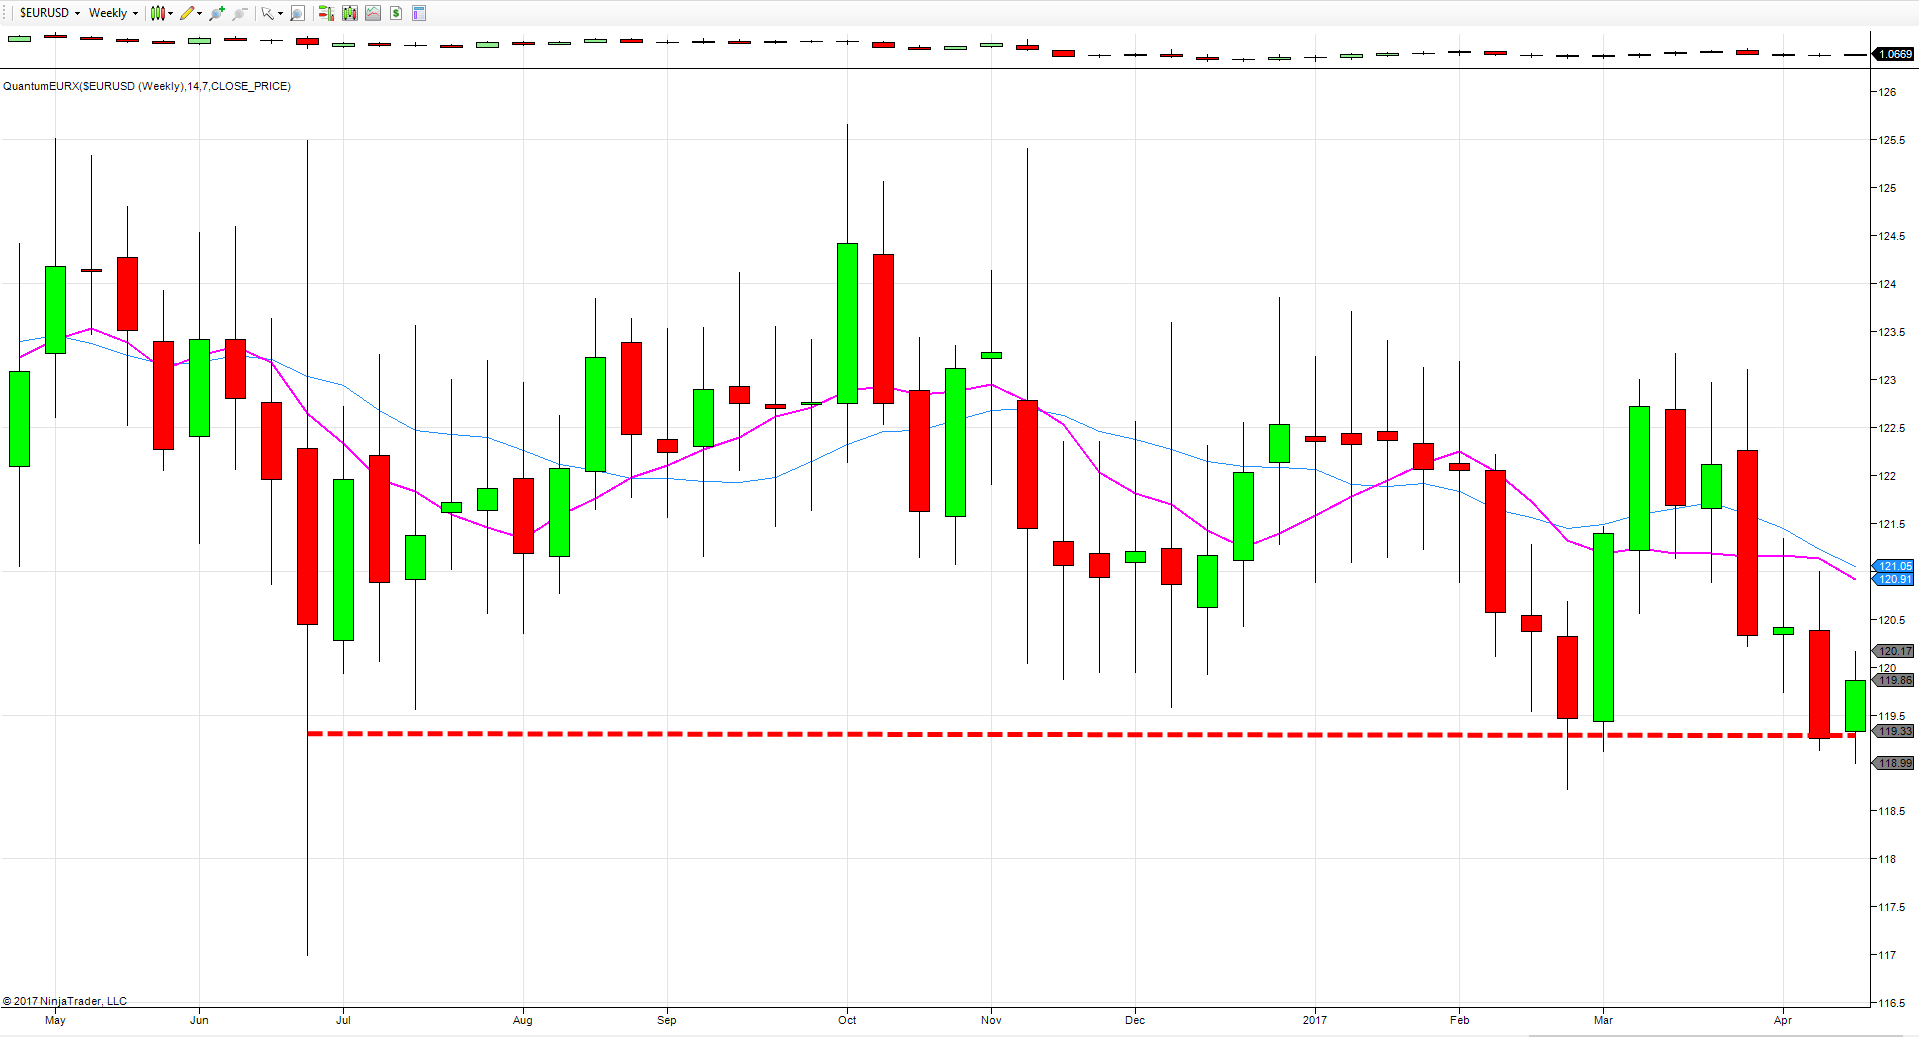 Moving to the weekly chart, this reinforces the slower timeframe, with price action defined as volatility with no trend once again, with a platform of support building in the 119.30 region and denoted with the red dotted line. This level has been tested over the last two weeks, and also in late February and early March, and to date has held firm. However, if this level is breached, we could see the start of a bearish trend develop in the longer term.
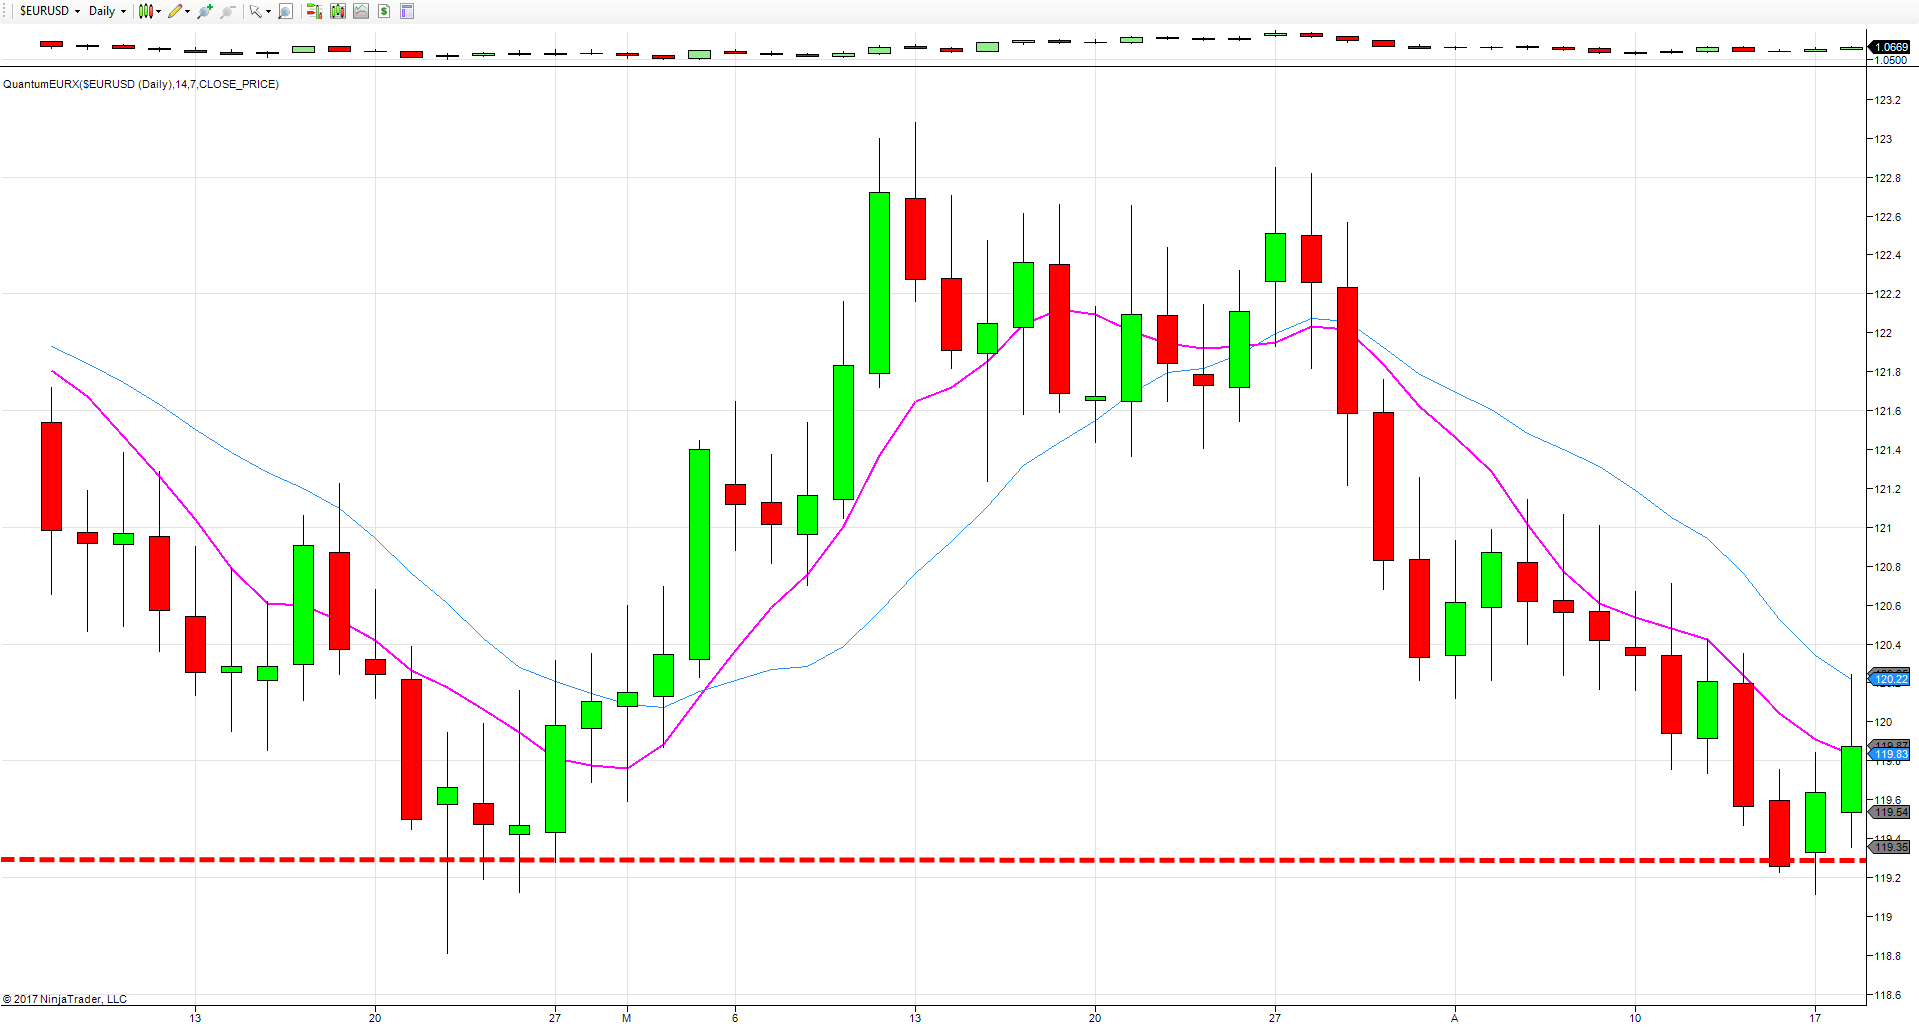 And finally to the daily chart where we can see this level more clearly being tested, and hence its significance. What the daily chart also signals clearly, is that whilst the longer term picture is one of volatile congestion, on the ‘faster’ chart of a daily timeframe the trend of later March and early April is clear and evidenced in pairs such as the EUR/JPY which has benefitted from both weakness in the euro coupled with strength in the yen. The 119.30 is now a key level, and if this is taken out on the daily chart, this may trigger a waterfall of bearish sentiment into the slower timeframes.
Which stock should you buy in your very next trade?
With valuations skyrocketing in 2024, many investors are uneasy putting more money into stocks. Unsure where to invest next? Get access to our proven portfolios and discover high-potential opportunities.
In 2024 alone, ProPicks AI identified 2 stocks that surged over 150%, 4 additional stocks that leaped over 30%, and 3 more that climbed over 25%. That's an impressive track record.
With portfolios tailored for Dow stocks, S&P stocks, Tech stocks, and Mid Cap stocks, you can explore various wealth-building strategies.