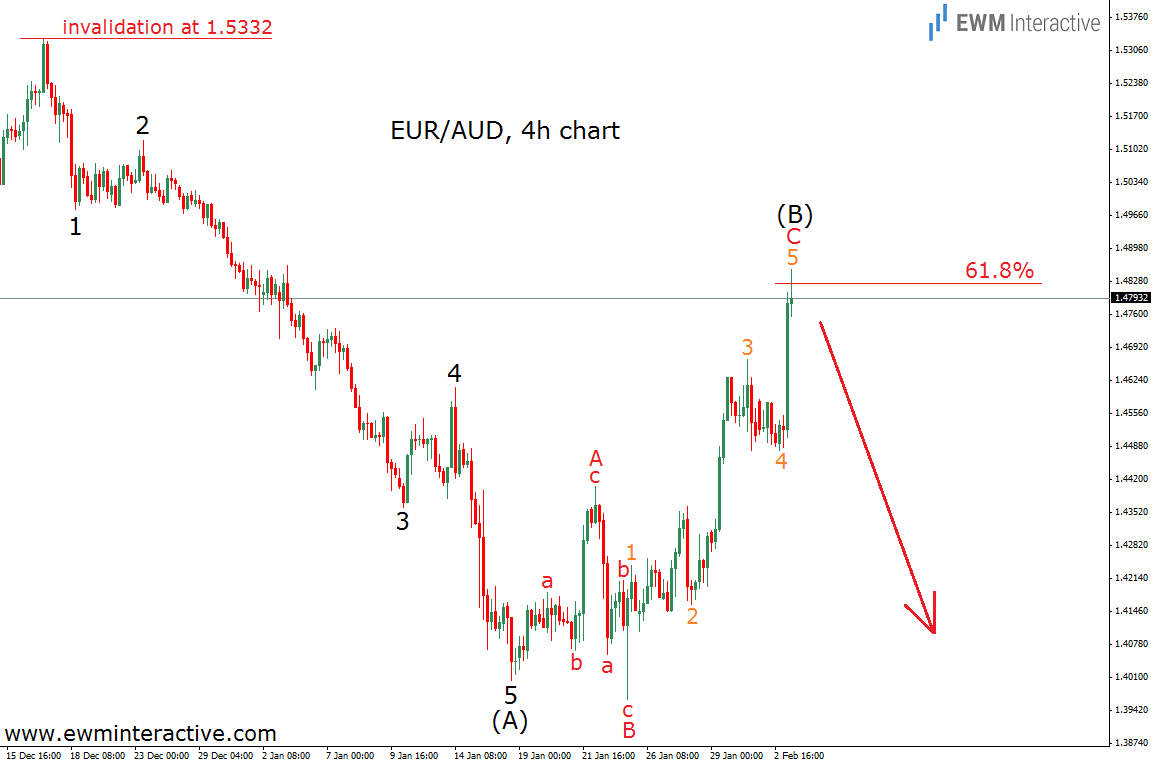
In the beginning of February, we posted a forecast of EUR/AUD, called “EUR/AUD Ready For Another Sell-Off”. In that material we applied the Elliott Wave Principle to the 4-hour chart of the Euro against the Australian dollar. This led us to the conclusion, that we should expect a large decline of roughly 1600 pips. The chart below will show you how the analysis looked like more than a month ago, when EUR/AUD was trading around 1.48.
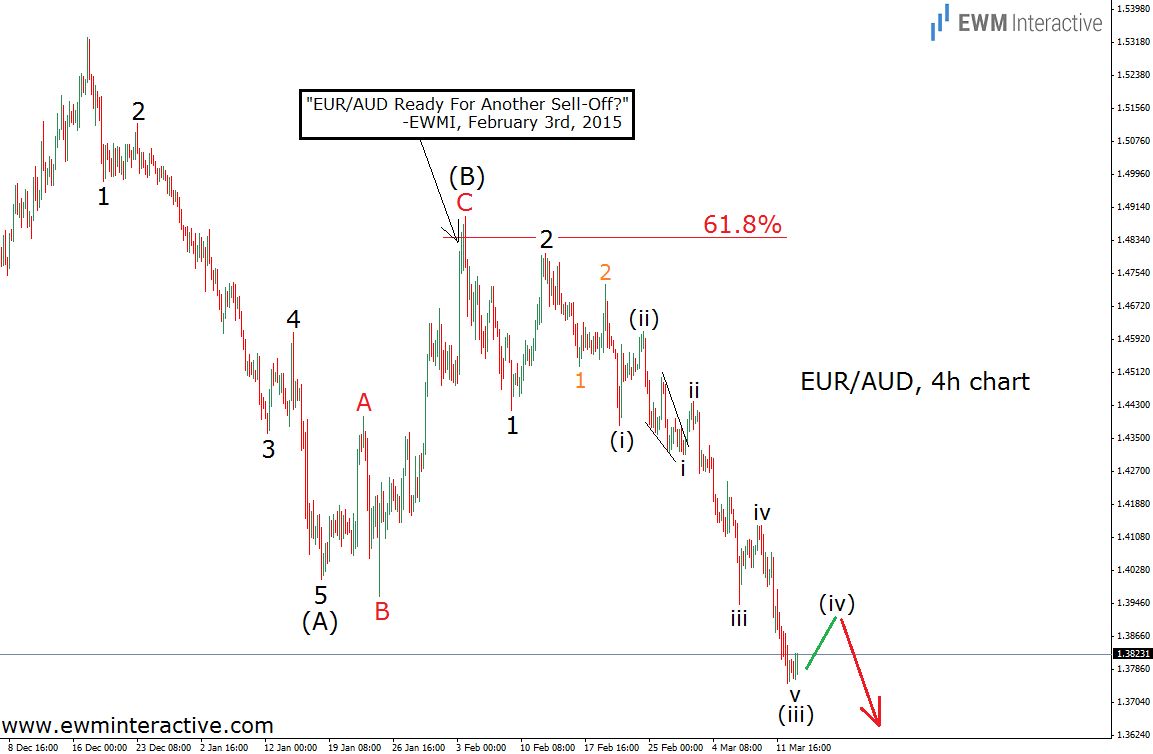
As visible, we had a perfectly looking 5-3 pattern. According to the theory, the exchange rate was supposed to go in the direction of the five-wave sequence. That is the reason why we were highly bearish about this pair. In addition, the 61.8% Fibonacci level was expected to serve as a resistance, which supported the idea as well. The anticipated 1600-pip decline is not done yet. However, EURAUD did fall by more than 1000 pips already. Yesterday it touched 1.3750, so now seems to be a good time for an update.
It appears wave (C) is currently developing. It still has a couple of fourth and fifth waves left to make, so the bears remain in the driving seat. This situation is a good of the Wave Principle’s ability to predict large movements. But there was a moment, which could have been confusing. Wave C of (B) is a perfect five-wave impulse. If you were to look only at it and ignore the bigger picture, you would have come to a totally different forecast. That is why it is extremely important to know where to start you Elliott Wave count from.
Which stock should you buy in your very next trade?
AI computing powers are changing the stock market. Investing.com's ProPicks AI includes 6 winning stock portfolios chosen by our advanced AI. In 2024 alone, ProPicks AI identified 2 stocks that surged over 150%, 4 additional stocks that leaped over 30%, and 3 more that climbed over 25%. Which stock will be the next to soar?
Unlock ProPicks AI