EUR/USD
In the last 24 hours the euro has fallen sharply back down below the key level of 1.3550 after hovering around 1.36 for several days. To finish out last week it settled right around the 1.36 level after earlier in the week moving up strongly through the resistance at 1.3550. In the week prior the euro did well to bounce strongly off support at 1.34 and recover the lost ground from the previous couple of days which saw it fall from the resistance level around 1.3550. This was after a few weeks which saw it move steadily higher from a support level at 1.33 back up to a three week high just above 1.3550. For some time now the 1.3550 has been a key level and this may continue to play a role should the euro ease back a little from its present levels. Towards the end of October the euro enjoyed a strong surge higher to move through to its highest level in nearly two years just above 1.38 before spending that week content to consolidate around this level. Over the following three weeks it fell heavily down to a support level at 1.33 before recovering well over the last few weeks. It moved quite well throughout the middle of October after breaking higher from its sideways range. For the month leading up to that, the euro traded within a narrow range between 1.3450 and 1.3650 before the range narrowed down to between 1.35 and 1.36. The former level of 1.35 was strongly tested a few weeks ago and has resurfaced as a significant level presently.
Throughout August the 1.34 level had been causing the euro headaches however several weeks ago it surged higher and moved through there to its then highest level since February just shy of 1.3570, which was past a couple of weeks ago moving to just shy of 1.3650. About a month ago the euro fell strongly away from the resistance level at 1.34 back to below the support level at 1.32 and in doing so traded to its lowest level in seven weeks very close to 1.31. Looking at the bigger picture the euro spent a lot of August and September trading within a range between 1.32 and 1.34 before recently pushing its range to between 1.3450 and 1.3650. Back in early July the euro was content to maintain the level above 1.31 and settle there, as it received solid support from both 1.30 and 1.31. On a couple of occasions it made an attempt to move within reach of the longer term resistance level at 1.32 and finally it finds itself trading on the other side of this level and being well established there.
Throughout May and most of June the euro surged higher to a four month high above 1.34. Before that in the first half of May, the euro fell considerably from near 1.32 down to six week lows near 1.28. Back at the beginning of April the euro received solid support around 1.28 and this level was called upon to provide additional support. Throughout this year the euro has moved very strongly in both directions. Throughout February and March the euro fell sharply from around 1.37 down to its lowest level since the middle of November around 1.2750. Sentiment has completely changed with the euro over the last few weeks and the last couple of months has seen a rollercoaster ride for the euro as it continued to move strongly towards 1.34 before falling very sharply to below 1.29 and setting a 6 week low.
eurozone factory orders rose for a fifth consecutive month in November, with activity accelerating at its fastest pace for more than two years, according to a survey. France was the only country out of the 17 that use the euro to report faster declines in both output and new orders. The Markit Manufacturing Purchasing Managers' Index (PMI) stood at 51.6 in November, up from 51.3 in October. Any reading of above 50 suggests expansion. Markit cautioned that the rate of growth was still "modest", with the most promising recovery signs confined to northern eurozone countries such as Germany and the Netherlands. France's PMI plummeted to a five-month low of 48.4 from 49.1, marking its 21st month of contraction. Spain's manufacturing activity also shrank in November, despite expanding for the previous three months. In Greece, which has been in recession for six years, manufacturing activity continued to shrink, but at the slowest pace since 2009. EUR/USD Daily Chart" title="EUR/USD Daily Chart" width="551" height="235">
 EUR/USD 4 Hourly Chart" title="EUR/USD 4 Hourly Chart" width="551" height="235">
The EUR/USD December 3 at 01:45 GMT 1.3536 H: 1.3616 L: 1.3524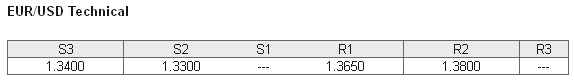 EUR/USD Technical Chart" title="EUR/USD Technical Chart" width="551" height="235">
During the early hours of the Asian trading session on Tuesday, the euro is continuing to drift lower after falling sharply in the last 24 hours to down below 1.3550. Current range: just below 1.3550 around 1.3535.
Further levels in both directions:
• Below: 1.3400 and 1.3300.
• Above: 1.3650 and 1.3800. EUR/USD Position Ratio Charts" title="EUR/USD Position Ratio Charts" width="551" height="235">
(Shows the ratio of long vs. short positions held for the EUR/USD among all OANDA clients. The left percentage (blue) shows long positions; the right percentage (orange) shows short positions.)
The EUR/USD long position ratio has moved back above 30% as the euro has fallen below 1.3550. The trader sentiment remains in favour of short positions.
Economic Releases
- 00:01 UK BRC Retail Sales Monitor (Nov)
- 00:30 AU Net Exports of GDP (Q3)
- 00:30 AU Current Account (Q3)
- 00:30 AU Retail trade (Oct)
- 00:30 AU RBA - Overnight Rate (Dec)
- 09:30 UK BoE publishes Record of Financial Policy Committee
- 09:30 UK CIPS/Markit Construction PMI (Nov)
- 10:00 EU PPI (Oct)
- 15:00 US IBD Consumer Optimism (Dec)
- 22:00 US Vehicle Sales (Nov)
Which stock should you buy in your very next trade?
AI computing powers are changing the stock market. Investing.com's ProPicks AI includes 6 winning stock portfolios chosen by our advanced AI. In 2024 alone, ProPicks AI identified 2 stocks that surged over 150%, 4 additional stocks that leaped over 30%, and 3 more that climbed over 25%. Which stock will be the next to soar?
Unlock ProPicks AI