
The US and EU Monday unveiled a set of sanctions in response to Crimea’s action in breaking away from Ukraine. Both governments limited the scope of these initial sanctions to travel restrictions and asset freezes targeting specific Russian, Ukrainian, and Crimean leaders. Washington and Brussels did not sanction the same officials, however. The discrepancy illuminates the wide difference between the two partners. The US targeted 11 people while the EU targeted 21, but only four people were on both lists, of whom only two are Russian. The US sanctions target senior members of the Russian elite, while the EU’s sanctions hit less significant individuals, many of whom are Ukrainian or Crimean, which doesn’t really matter to Russia. Plus the Russian officials targeted are less important than those targeted by the US.
The weakness of this initial move was a relief to the market and the risk premium in the market eased. The VIX index fell, US bond yields rose, gold and oil collapsed and the dollar generally weakened. The best performing currency was the RUB as Russian stocks soared around 4%. In the G10, most currencies gained vs USD except for the safe-haven JPY, which lost some of its appeal. SEK and NOK, currencies of two countries that sent most of their exports to Europe, performed the best within the G10.
The discrepancy between the US and EU sanctions highlights the different risks that both sides are running. Europe is much more exposed to any countermoves by Russia: it gets half of its gas and oil from Russia, Germany has large industrial investments in Russia, and there is an enormous amount of Russian capital in London. Europe’s main concern right now is to manage its economic problems, and a rise in tension with Russia and disruption of energy supplies would be a significant setback. The US on the other hand sees an opportunity to curb Russia’s recent resurgence in its periphery and prove to Eastern Europe that it is a reliable foreign policy partner. Getting back at Russia for the Snowden affair must also be tempting.
Washington and Brussels both said that yesterday’s sanctions were an initial round. They will reconsider their response after hearing what President Putin has to say today and how things develop. The leaders of the EU meet on Thursday and Friday and will reconsider their response. It remains to be seen whether Washington and Brussels can close the gap between their positions and present a united front with more significant sanctions, or whether Russia will successfully play off the different interests that the two sides have. We haven’t heard the end of this drama by any means.
Today is the first day of the March FOMC meeting, the first chaired by the new FOMC Chair, Janet Yellen, and her first press conference as FOMC head. I would guess that nobody expects any change in the “tapering” process, that is, the Committee is likely to reduce its monthly bond purchases by another USD 10bn. There is likely to be a change in the presentation of the FOMC’s forward guidance, much like occurred in the UK. I expect them to drop the line in the statement that says they will keep rates at their current level “as long as the unemployment rate remains above 6 1/2 %” and instead replace it with some fuzzier criteria on unemployment and inflation. However, the Committee will want to do this without giving the market any reason to think that rates will be hiked sooner than previously thought, so they will probably emphasize that they continue to expect it will be quite some time before they start to hike rates and that when they do start, they will do so slowly and cautiously – much like what the Bank of England said. Nonetheless the experience of the BoE shows that this change could support the dollar.
The main event during the European day will be the German ZEW survey for March. The current situation index is forecast to rise to 52.0 from 50.0 in February, while the expectation index is expected to be down to 52.0 from 55.7. Last month the current situation index was better than expected, while the expectations index missed estimates. EUR/USD responded to the expectations index and declined 15 pips. Separately, Eurozone’s trade surplus is expected to have risen slightly to EUR 13.9bn on a seasonally adjusted basis, from EUR 13.7bn in February.
In the US, the FOMC starts its two day meeting, which ends on Wednesday. The meeting will be associated with a summary of Economic projections and the first press conference held by the new Chairperson Janet Yellen. As for the US indicators, the CPI is forecast to rise 0.1% mom in February, the same as in January, driving the yoy rate down to +1.2% from +1.6%. Both the housing starts and building permits for February are expected to have improved.
Three speakers are scheduled on Tuesday. Bank of England Governor Mark Carney, ECB Supervisory Board Chairman Daniele Nouy and Bank of Canada Governor Stephen Poloz.
The Market
EUR/USD
 EUR/USD Hour Chart" title="EUR/USD Hour Chart" width="474" height="242" />
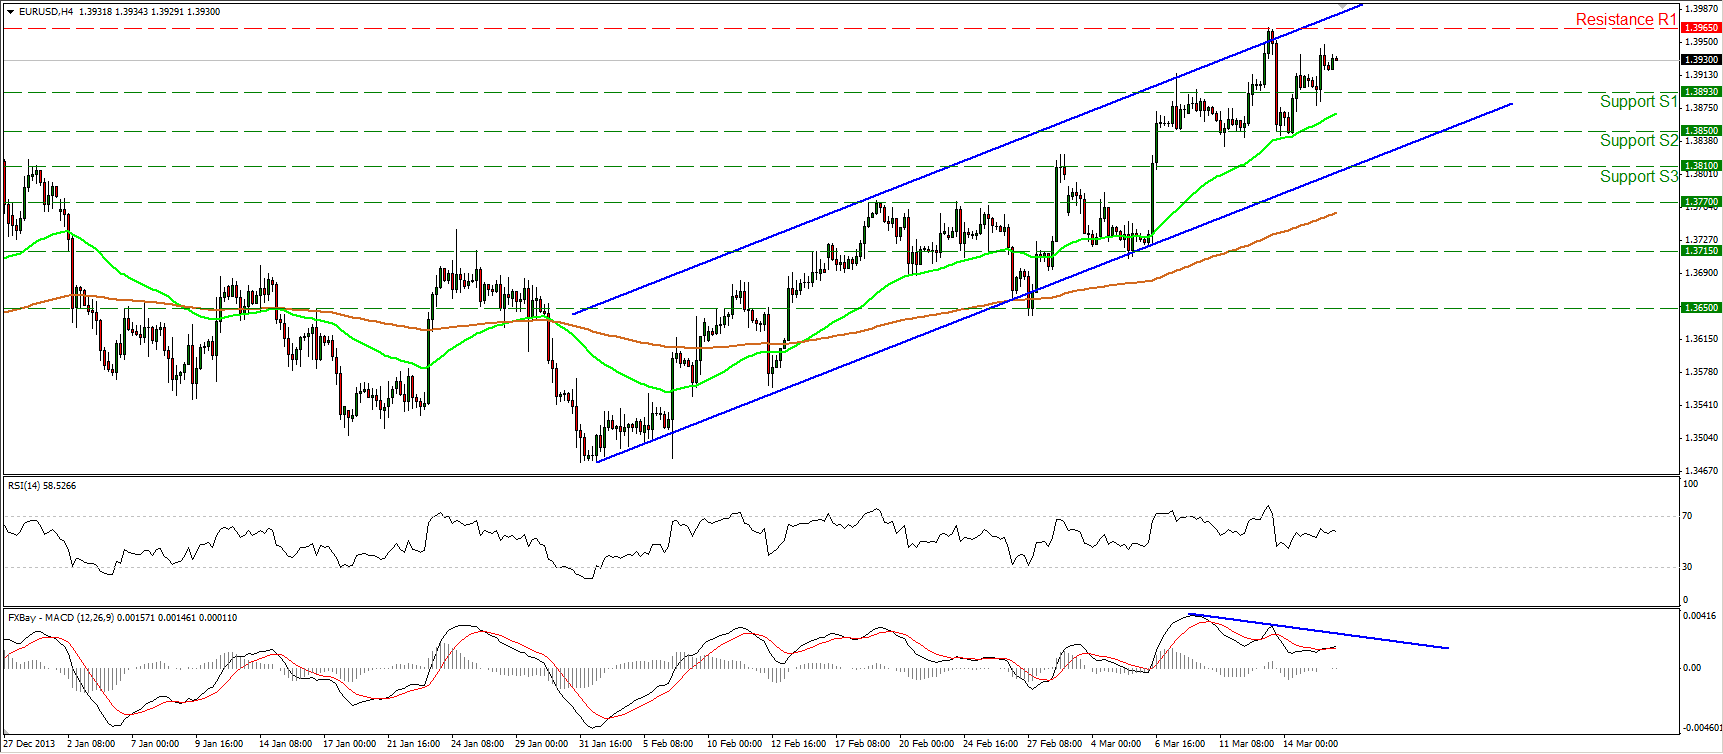
The EUR/USD found support near the 1.3893 (S1) barrier and moved higher. The pair remains below the 1.3965 (R1) resistance, where a clear upward break may trigger bullish extensions towards the next hurdle at 1.4000 (R2). Even though the MACD managed to cross above its trigger line, the negative divergence between the MACD and the price action remains in effect, thus a possible pullback in the near future cannot be ruled out. The structure of higher highs and higher lows remains in progress and since the rate is trading within the upward sloping channel, I still consider the short-term picture to be positive.
• Support: 1.3893 (S1), 1.3850 (S2), 1.3810 (S3).
• Resistance: 1.3965 (R1), 1.4000 (R2), 1.4200 (R3).
EUR/JPY
 EUR/JPY Hour Chart" title="EUR/JPY Hour Chart" width="474" height="242" />
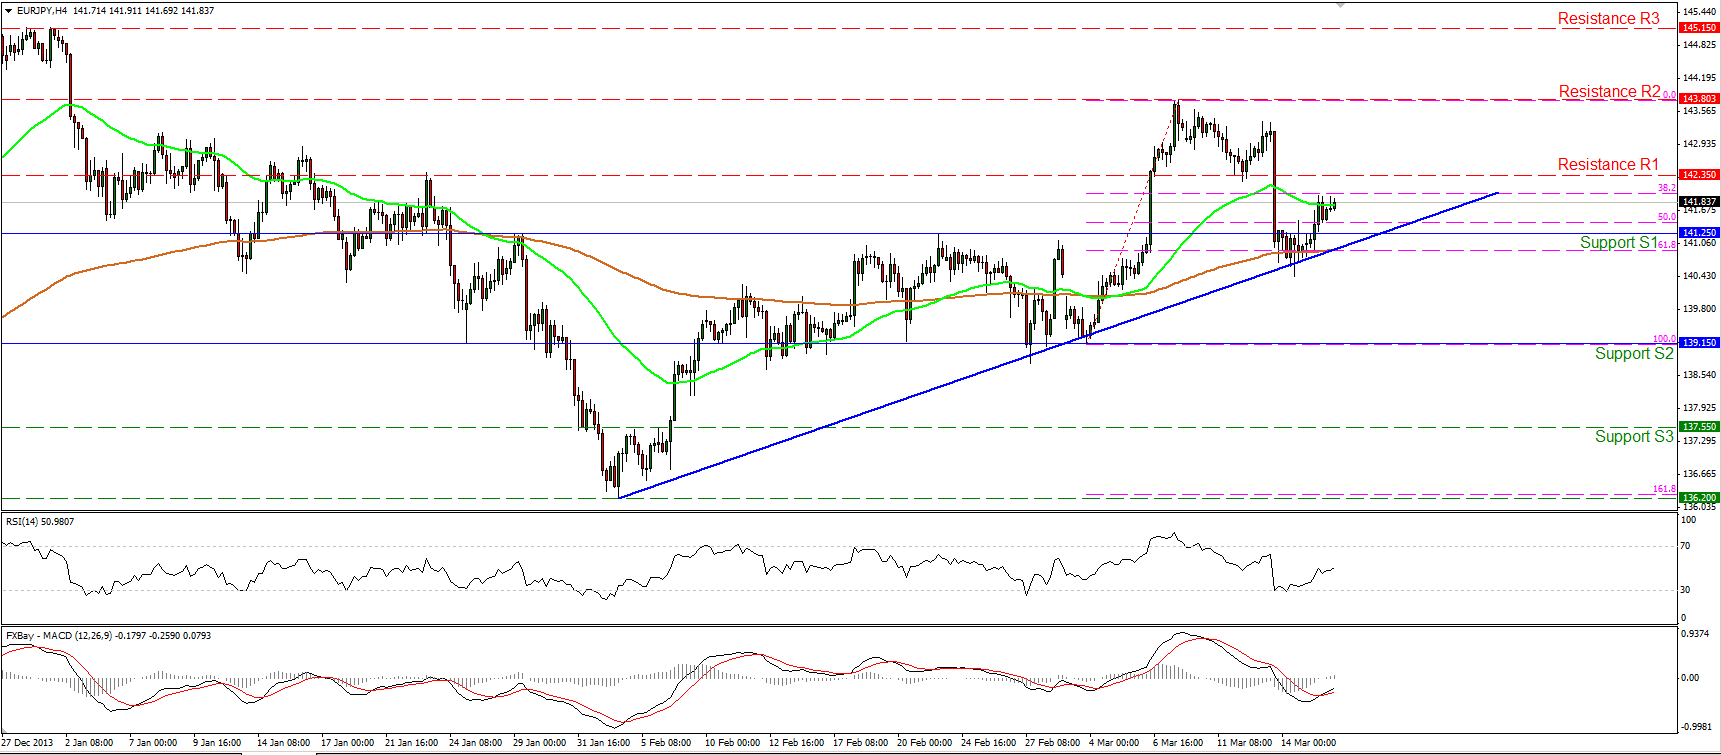
The EUR/JPY rebounded near the 61.8% retracement level of the 3rd – 7th March advance, the 200-period moving average and the blue uptrend line. The pair is once again above the 141.25 bar and if the bulls are strong enough to overcome the next obstacle at 142.35 (R1), I would expect them to target the next resistance at 143.80 (R2). The MACD crossed above its trigger line but remains within its bearish territory. I would wait for a cross of the indicator above its zero line to confirm a possible break above 142.35 (R1).However, the possibility for a lower high near that bar still exists, thus I maintain my neutral view for now.
• Support: 141.25 (S1), 139.15 (S2), 137.55 (S3)
• Resistance: 142.35 (R1), 143.80 (R2), 145.15 (R3).
GBP/USD
 GBP/USD Hour Chart" title="GBP/USD Hour Chart" width="474" height="242" />
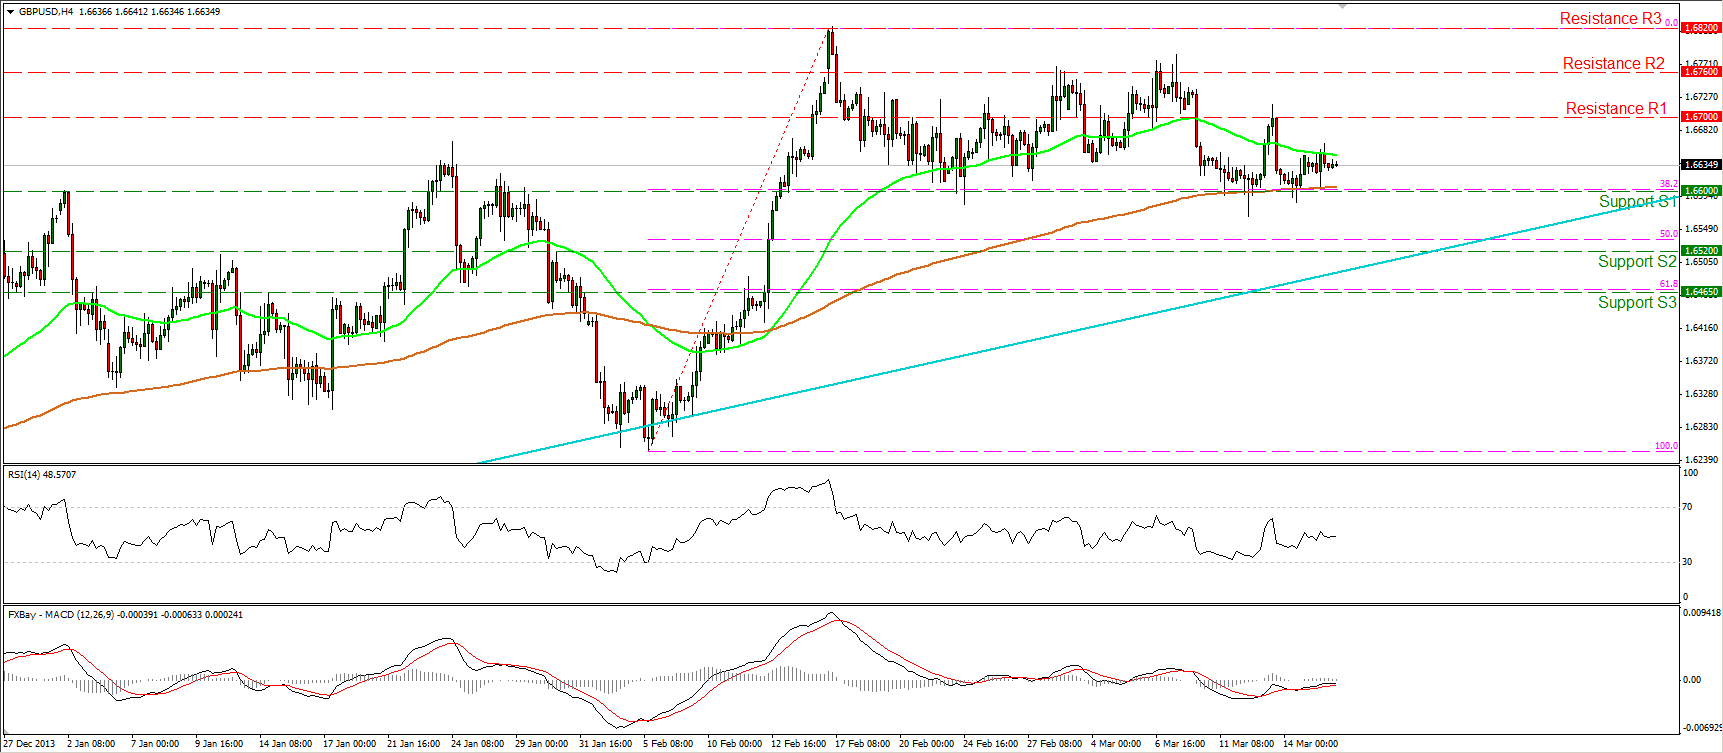
The GBP/USD moved in a consolidative mode, remaining between the support of 1.6600 (S1), which coincides with the 38.2% retracement level of the 5th – 17th Feb. rally, and the resistance of 1.6700 (R2). The short term picture remains neutral in my view, since both the moving averages are pointing sideways, while both the RSI and the MACD lie near their neutral levels, confirming the non-trending phase of the price action. In the bigger picture, as long as the rate is trading above the long-term uptrend (light blue line), I consider the major upward path to remain intact. However, a decisive break above the highs at 1.6820 (R3) is needed to confirm the resumption of the larger uptrend.
• Support: 1.6600 (S1), 1.6520 (S2), 1.6465 (S3).
• Resistance: 1.6700 (R1), 1.6760 (R2), 1.6820 (R3).
Gold

Gold moved lower and is currently trading near the 50-period moving average, slightly above the 1354 (S1) support. Both our momentum studies follow downward paths, while the MACD, although in its bullish territory, crossed below its trigger line, confirming the deceleration in the metal’s momentum. On the daily chart, the daily RSI exited overbought conditions, while the daily MACD seems ready to fall below its signal line, favoring further declines. However, as long as the low of 1332 (S2) holds I would consider any downward wave as a retracement.
• Support: 1354 (S1), 1332 (S2), 1310 (S3).
• Resistance: 1392 (R1), 1415 (R2), 1435 (R3)
Oil

WTI moved lower on Monday and is once again near the 98.00 (S1) support, the 50% retracement of the 9th Jan. – 3rd Mar. uptrend and the 161.8% extension of the width of the failure swing mentioned in previous comments. I still expect the bears to drive the battle below 98.00 (S1) and target the 61.8% retracement of the 9th Jan. – 3rd Mar. uptrend which coincides with the 200% extension of the pattern’s width, near the support of 96.50 (S2). As long as the price is trading within the downward sloping channel and below both the moving averages, the short-term outlook remains negative.
• Support: 98.00 (S1), 96.50 (S2), 95.00 (S3)
• Resistance: 100.75 (R1), 103.00 (R2), 105.00 (R3).
BENCHMARK CURRENCY RATES - DAILY GAINERS AND LOSERS

MARKETS SUMMARY

Disclaimer: This information is not considered as investment advice or investment recommendation but instead a marketing communication. This material has not been prepared in accordance with legal requirements designed to promote the independence of investment research, and that it is not subject to any prohibition on dealing ahead of the dissemination of investment research. IronFX may act as principal (i.e. the counterparty) when executing clients’ orders. This material is just the personal opinion of the author(s) and client’s investment objective and risks tolerance have not been considered. IronFX is not responsible for any loss arising from any information herein contained. Past performance does not guarantee or predict any future performance. Redistribution of this material is strictly prohibited.
Risk Warning: Forex and CFDs are leveraged products and involves a high level of risk. It is possible to lose all your capital. These products may not be suitable for everyone and you should ensure that you understand the risks involved. Seek independent advice if necessary. IronFx Financial Services Limited is authorised and regulated by CySEC (Licence no. 125/10). IronFX UK Limited is authorised and regulated by FCA (Registration no. 585561). IronFX (Australia) Pty Ltd is authorized and regulated by ASIC (AFSL no. 417482)
Which stock should you buy in your very next trade?
With valuations skyrocketing in 2024, many investors are uneasy putting more money into stocks. Unsure where to invest next? Get access to our proven portfolios and discover high-potential opportunities.
In 2024 alone, ProPicks AI identified 2 stocks that surged over 150%, 4 additional stocks that leaped over 30%, and 3 more that climbed over 25%. That's an impressive track record.
With portfolios tailored for Dow stocks, S&P stocks, Tech stocks, and Mid Cap stocks, you can explore various wealth-building strategies.