
Who says cycles don’t exist? Today, we put cycles on full display by looking at the performance of two of the most important asset classes: Equities and Commodities.
The chart below takes a long-term “monthly” view of the performance ratio of the S&P 500 Index/Thomson Reuters Commodities Index.
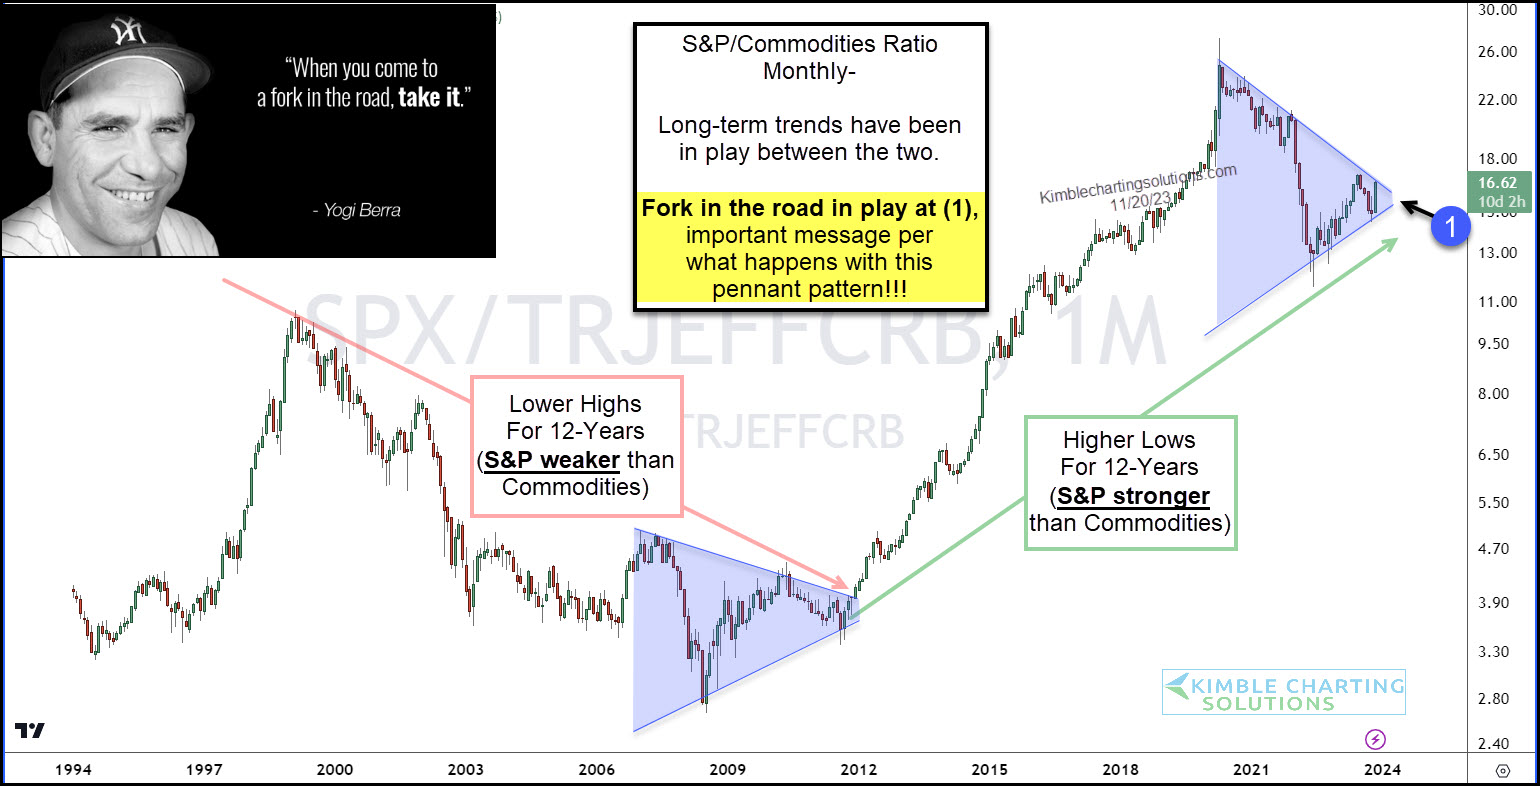
As you can see, a couple of long-term trends have been in play over the past 25 years. Moreover, looks like cycles of 12 years a piece (Commodities lead, then S&P 500 leads).
Currently, a pennant pattern looks to be nearing completion at (1). The last time this pattern was in play, a long-term trend reversal took place.
Will equities continue to show strength and we see one more breakout or will equities wilt in the face of commodities and break down.
In my humble opinion, what happens at (1), could send a very important message about investment allocations. Stay tuned.
Which stock should you buy in your very next trade?
AI computing powers are changing the stock market. Investing.com's ProPicks AI includes 6 winning stock portfolios chosen by our advanced AI. In 2024 alone, ProPicks AI identified 2 stocks that surged over 150%, 4 additional stocks that leaped over 30%, and 3 more that climbed over 25%. Which stock will be the next to soar?
Unlock ProPicks AI