Bitcoin price today: down to $117.9k as Fed, tariff caution offsets Strategy buy

Today's release of the Leading Economic Index showed improvement in the economy. While the last several months of reading in the index have been driven by Fed manipulated indicators such as the yield curve and money supply, as well as the stock market to some extent, this month showed improvement in other areas such as building permits. The strong October rally in the S&P 500 played a pivotal push in the overall index. The question, of course, is whether or not this is sustainable going into the new year.
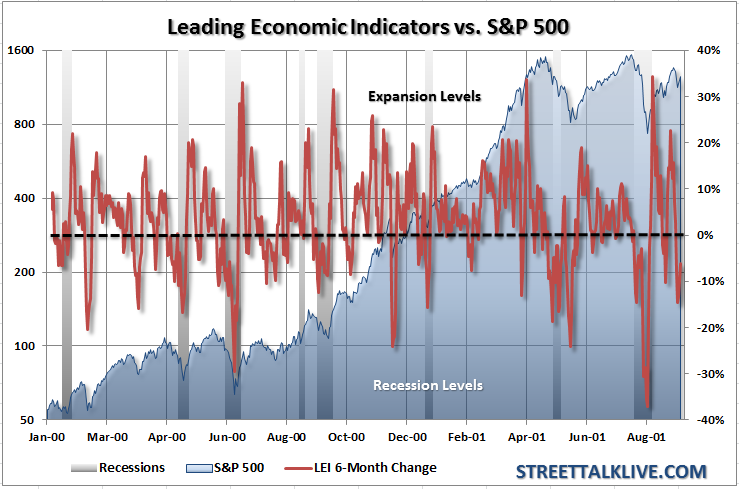
With oil prices rising and the European economy downshifting towards recession we remain very concerned. Our recession call for the first half of 2012 is still very much alive and well and it is yet to be seen whether these are real improvements in the underlying economy or just temporary adjustments in the overall cycle. With the U.S. economy maintaining an 86% correlation to the European economy the ripple effect from any recession in the Eurozone will most assuredly wash ashore in the U.S.
However, we cannot deny the improvement in a lot of the recent economic data particularly in the regional manufacturing surveys. This brings us to our Streettalk Economic Output Composite Index (EOCI). We have written in the past that this index is extremely broad in nature and includes the majority of the Fed's regional data, the Chicago National Activity Index, NFIB survey, Leading Indicators and others. This weighted average gives us a very broad overview of the economic output as a whole.
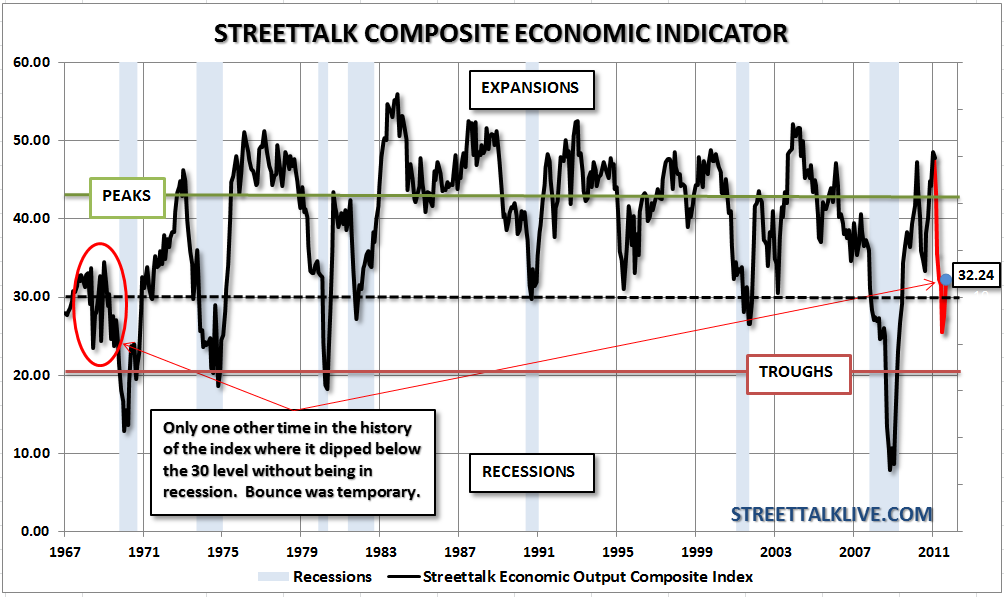
On a very positive note that EOCI index up ticked back above the 30 level to 32.24. This is very interesting because in the entire history of the index it has never dipped below 30 without the economy being in, or going into, recession - except once. In 1968-1970 the index slipped below the critical level of 30 and then recovered briefly above it. This occurred without a recession in tow. However, it quickly fell below it once again and the economy slipped into recession. It is my best guess that this may potentially be the case today. The drawdown economically this summer was swift and sudden due to political and government upheaval over the debt ceiling limits and Greek riots. That also occurred as the vacuum left by the Japan earthquake was just beginning to close.
Therefore, it is highly likely that the bump in the economic data, all of which are in still very negative trends overall, is simply an adjustment from the hole that was created by a confluence of manufacturing and psychological events. The next couple of months will be very important to in order to see if the trend of the data can continue to improve. If it does then we will become much more constructive on the economy and the markets. However, in the meantime we remain a tad bit skeptical and sufficiently hedged in our portfolios.
With oil prices rising and the European economy downshifting towards recession we remain very concerned. Our recession call for the first half of 2012 is still very much alive and well and it is yet to be seen whether these are real improvements in the underlying economy or just temporary adjustments in the overall cycle. With the U.S. economy maintaining an 86% correlation to the European economy the ripple effect from any recession in the Eurozone will most assuredly wash ashore in the U.S.
However, we cannot deny the improvement in a lot of the recent economic data particularly in the regional manufacturing surveys. This brings us to our Streettalk Economic Output Composite Index (EOCI). We have written in the past that this index is extremely broad in nature and includes the majority of the Fed's regional data, the Chicago National Activity Index, NFIB survey, Leading Indicators and others. This weighted average gives us a very broad overview of the economic output as a whole.
On a very positive note that EOCI index up ticked back above the 30 level to 32.24. This is very interesting because in the entire history of the index it has never dipped below 30 without the economy being in, or going into, recession - except once. In 1968-1970 the index slipped below the critical level of 30 and then recovered briefly above it. This occurred without a recession in tow. However, it quickly fell below it once again and the economy slipped into recession. It is my best guess that this may potentially be the case today. The drawdown economically this summer was swift and sudden due to political and government upheaval over the debt ceiling limits and Greek riots. That also occurred as the vacuum left by the Japan earthquake was just beginning to close.
Therefore, it is highly likely that the bump in the economic data, all of which are in still very negative trends overall, is simply an adjustment from the hole that was created by a confluence of manufacturing and psychological events. The next couple of months will be very important to in order to see if the trend of the data can continue to improve. If it does then we will become much more constructive on the economy and the markets. However, in the meantime we remain a tad bit skeptical and sufficiently hedged in our portfolios.
3rd party Ad. Not an offer or recommendation by Investing.com. See disclosure here or remove ads.
Which stock should you buy in your very next trade?
AI computing powers are changing the stock market. Investing.com's ProPicks AI includes 6 winning stock portfolios chosen by our advanced AI. In 2024 alone, ProPicks AI identified 2 stocks that surged over 150%, 4 additional stocks that leaped over 30%, and 3 more that climbed over 25%. Which stock will be the next to soar?
Unlock ProPicks AI