Trump slaps 30% tariffs on EU, Mexico
The current stock market cycle has been compared to everything from the 1920's, 70's, 90's, you name it. I will readily agree that, in all the comparisons, the price patterns are similar, however, correlation is not causation. What is ALWAYS left out of the conversation are the fundamental underpinnings that either supported or impeded those previous market cycles as compared to today.
Today, Business Insider produced the following chart and commentary by Jeff Saut:
In his new weekly Investment Strategy comment, Saut notes that these things work in both directions. Here's Saut:
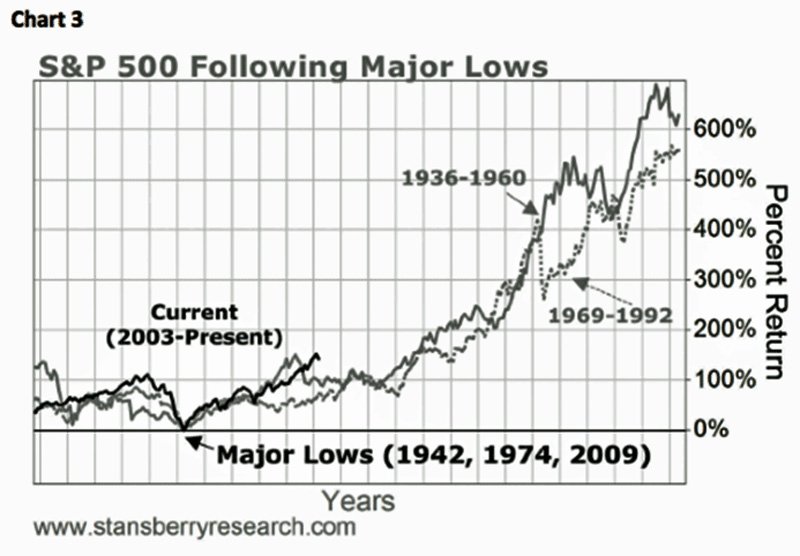
"Accordingly, the alleged pundits that called for a “crash” four weeks ago have, at least so far, also been proven wrong, which I discussed when dissecting their comparison chart to 1929 showing that when comparing apples-to-apples the correlation totally breaks down (see chart 1 and 2). In fact, as proof that you can make ratio charts do just about anything you want, take a look at chart 3 that suggests this secular bull market has another 300% to 400% left on the upside."
There are two major issues with that statement. First, Business Insider extracted selected verbiage which makes it seem as though Jeff Saut is suggesting that the markets have 300-400% more upside to go. That is not exactly the case. Below is actually what Jeff Saut wrote:
"A few weeks ago it was the correlation to the 1929 stock market rally that led to the ’29 crash that made the rounds. I wrote about that, noting that the folks making said comparison were using ratio-adjusted charts, which can make the charts show just about anything you want them to. The same thing happened with Japan’s Nikkei Index in the early 1990s and that also proved to be wrong. Accordingly, the alleged pundits that called for a 'crash' four weeks ago have, at least so far, also been proven wrong, which I discussed when dissecting their comparison chart to 1929 showing that when comparing apples-to-apples the correlation totally breaks down. In fact, as proof that you can make ratio charts do just about anything you want, take a look at that suggests this secular bull market has another 300% to 400% left on the upside."
The point Jeff was trying to make is that you can take any multiple of data series, and with the right manipulation, you can torture the data into saying whatever you want. As the old saying goes:
"There are three types of lies: Lies, Damned Lies and Statistics."
Secondly, and much more important, is that while it is true that history does "rhyme", it does not repeat. As I stated in the opening, there are specific fundamental underpinnings that supported the rampant secular bull markets that followed the major secular bear market lows of 1942 and 1974 which simply do not exist, as of yet, today.
One of the primary drivers that assisted in ending the "Great Depression" was the massive Government spending ramp, roughly 125% of GDP that was used to support WWII. The surges in industrial production to support the war led to increased employment as women entered the work force while husbands, brothers and fathers were deployed overseas. However, what drove the secular bull market of the 50's and 60's was "Johnny" returning home from war. For years, everything had been rationed for the war effort, now the focus turned back to building families, homes and lives which lead to increased consumption as "pent up demand" was met. However, more importantly, the United States became the industrial manufacturing powerhouse of the world. With Europe, Japan and Russia in ruins following the war, the U.S. produced and shipped goods and products overseas for the rebuilding of war torn countries. Government debt fell to historically low levels, household debt remained modest relative to incomes and personal savings rates were high which led to productive investment. Even as interest rates rose, economic growth continued to rise giving a broad lift to prosperity.
This is something that I discussed at length in "Correcting Some Misconceptions Of A New Secular Bull Market:"
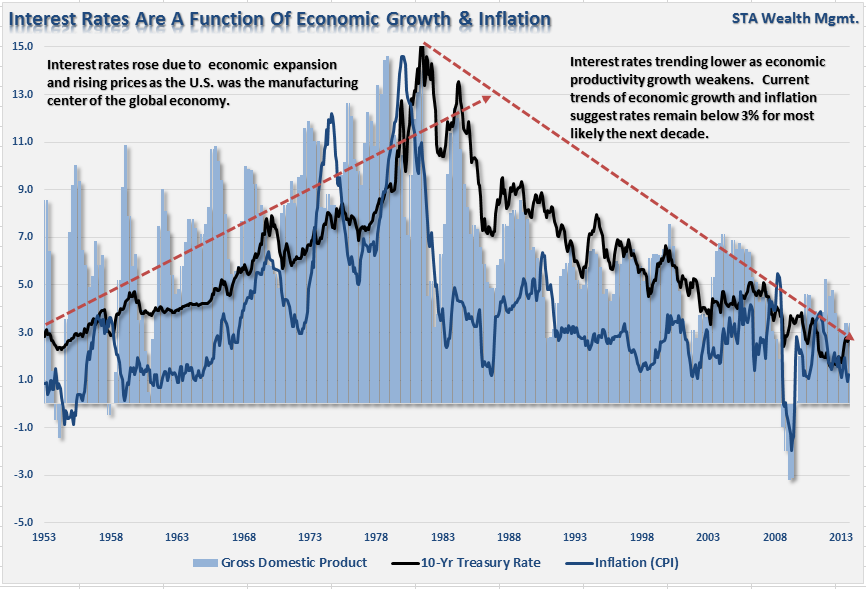
"The United States became the manufacturing center of the industrialized world as we assisted in the rebuilding of Germany, Britain, France and Japan. That is no longer the case today as much of our industrial manufacturing has been outsourced to other countries for lower costs. The chart below shows interest rates overlaid against the annual changes in economic growth."
The secular bull market of 80's and 90's is also something that we are unlikely to witness again in our lifetimes. Unlike the secular boom of the 50's which was driven by "healthy" consumption, the boom of the 80's and 90's was an unhealthy "debt driven" demand cycle which was fostered by an era of falling interest rates, inflation and financial deregulation. As I stated in "Past Is Prologue:"
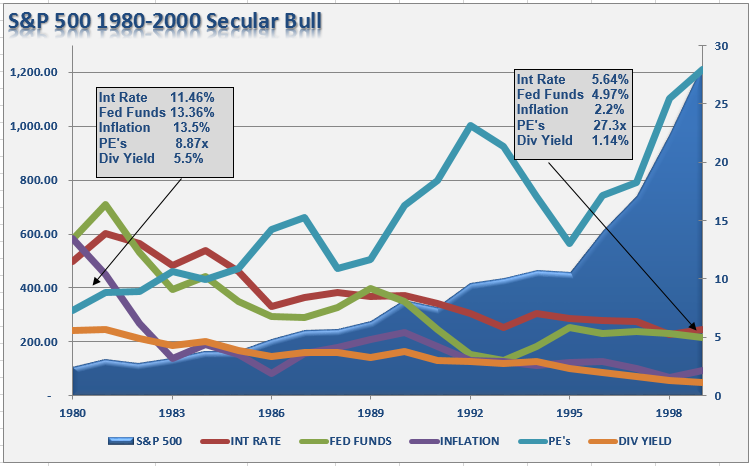
"The next chart shows the much beloved and hoped for, secular bull market of the 1980's and 90's."
"There were several contributing factors that drove that particular secular bull market:
1) Inflation and interest rates were high and falling which boosted corporate profitability.
2) The extreme negative sentiment of the late 70's was finally undone by the early 90's. (At the turn of the century, roughly 80% of all individual investors in the market began investing after 1990. 80% of that total started after 1995 due to the investing innovations created by the internet. The majority of these were "boomers.")
3) Large foreign net inflows to chase the "tech boom" drove prices to extreme levels.
4) The mirage of consumer wealth, driven by declining inflation and interest rates and easy access to credit, inflated consumption, corporate profits and economic growth.
5) Corporate profits were boosted by deregulation of industries, wage suppression, outsourcing and productivity increases.
6) Pension funding requirements and accounting standards were eased which increased corporate profits.
7) Stock based executive compensation was grossly expanded which led to more "accounting gimmickry" to sustain stock price levels.
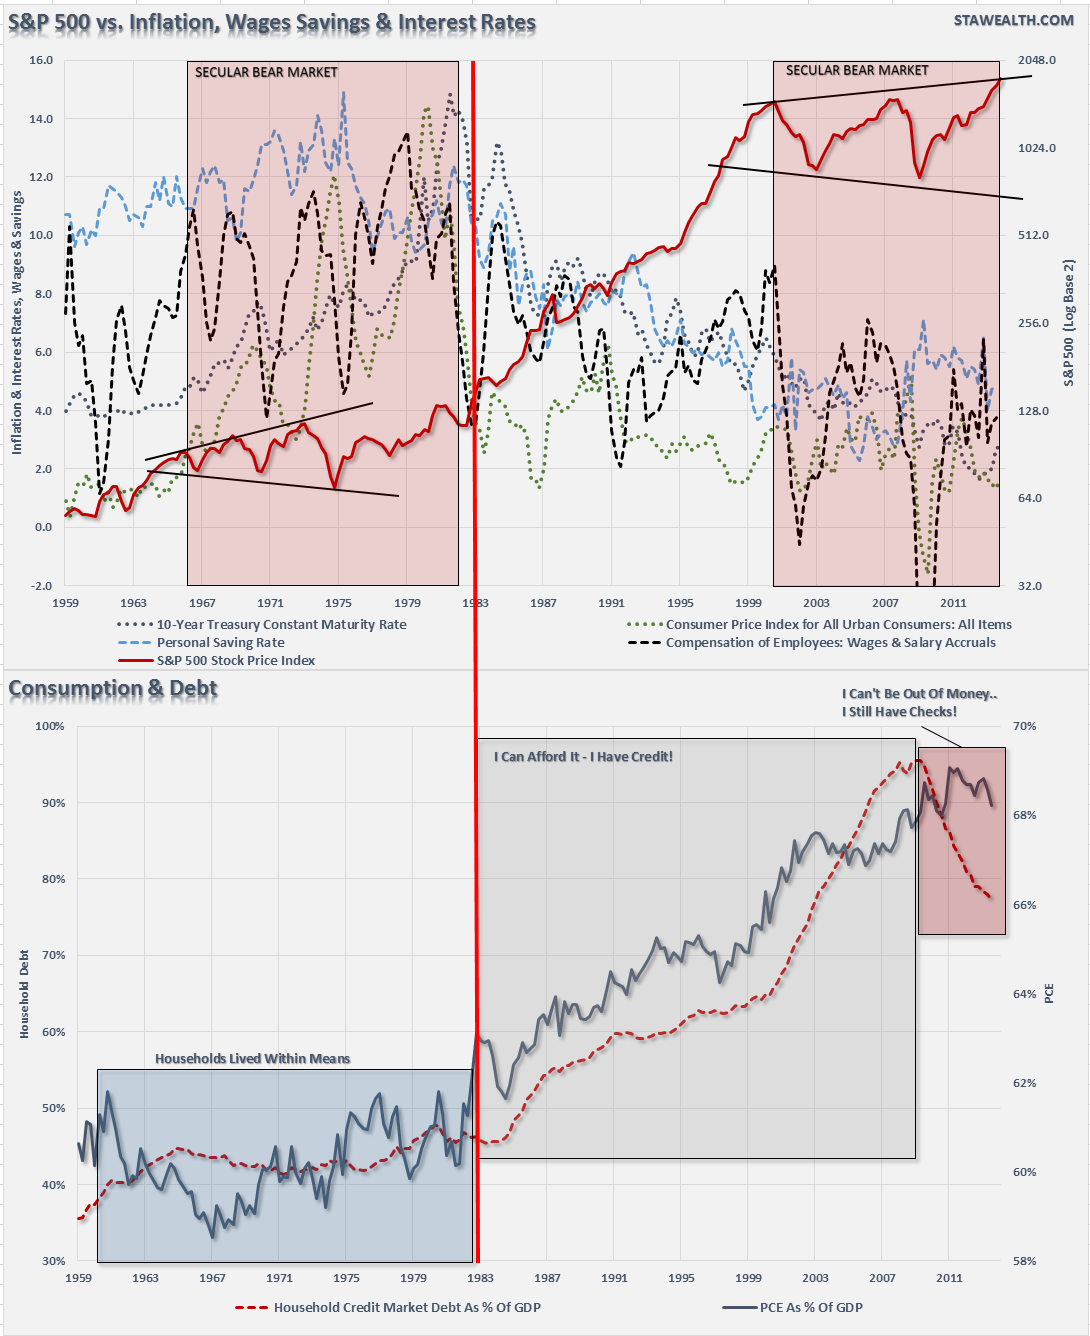
The dual panel chart below shows the economic fundamentals versus the S&P 500 and the change that occurred beginning in 1983. (Red dividing line)"
"I have also noted the expanding "megaphone" pattern in the current market as compared to that of the 60's and 70's."
Conclusion
Despite much hope that the current breakout of the markets is the beginning of a new secular "bull" market - the economic and fundamental variables suggest otherwise. Valuations and sentiment are at very elevated levels while interest rates, inflation, wages and savings rates are all at historically low levels. This set of fundamental variables are normally seen at the end of secular bull market periods.
Lastly, the consumer, which comprises roughly 70% of economic growth is unable significantly increase their consumption, as a percent of the economy, as the capacity to releverage to their balance sheet is no longer available. This "deleveraging" of balance sheets by the aging baby boomers, as they move through retirement, will further exacerbate the consumption side of the economic equation.
As I have said many times in the past I am currently maintaining fully allocated portfolio models. As a money manager, I must participate with rising markets or suffer career risk. However, while being a "stark raving bull" going into 2014 is certainly fashionable currently; as investors, we should place our faith, and hard earned savings, into the reality of the underlying fundamentals. As I said at the beginning of the missive, it is disingenuous to manipulate the data to support a bullish thesis.
In my opinion, this is the wrong way to view the markets. Participating with rising markets is the easy part. As investors, we should focus our analysis on what can go wrong. The "glass is always half full" commentary leads investors into taking on substantially more investment risk than they realize as markets are rising. It is the unwinding of that "risk" that leads the majority of investors to unrecoverable losses. Most importantly, one absolutely unrecoverable commodity that is lost during mean reverting events is our most precious form of investment capital - "time." The reality is that we will not live forever. By allowing "greed" to drive investment decisions the eventual "mean reversion" destroys our singularly most precious form of investment capital.
On that note, it is entirely conceivable that stock prices can be driven higher through the Federal Reserve's ongoing interventions, current momentum, and excessive optimism. However, the current economic variables, demographic trends and underlying fundamentals make it currently impossible to "replay the tape" of the 80's and 90's. These dynamics increase the potential of a rather nasty mean reversion at some point in the future. The good news is that it is precisely that reversion that will likely create the "set up" necessary to launch the next great secular bull market. However, as was seen at the bottom of the market in 1974, there were few individual investors left to enjoy the beginning of that ride.
Which stock should you buy in your very next trade?
With valuations skyrocketing in 2024, many investors are uneasy putting more money into stocks. Unsure where to invest next? Get access to our proven portfolios and discover high-potential opportunities.
In 2024 alone, ProPicks AI identified 2 stocks that surged over 150%, 4 additional stocks that leaped over 30%, and 3 more that climbed over 25%. That's an impressive track record.
With portfolios tailored for Dow stocks, S&P stocks, Tech stocks, and Mid Cap stocks, you can explore various wealth-building strategies.


