It was a fairly light week of economic data with the stand out reports being consumer credit, wholesale trade and inventories, trade deficit, and productivity. The overriding themes of these reports continues to show a weakening undercurrent of the overall economy but strength in some of the recent headline data, such as jobless claims, employment and GDP combined with rising food prices is likely to keep the Fed on hold with further stimulative programs for the time being.
Wholesale Trade
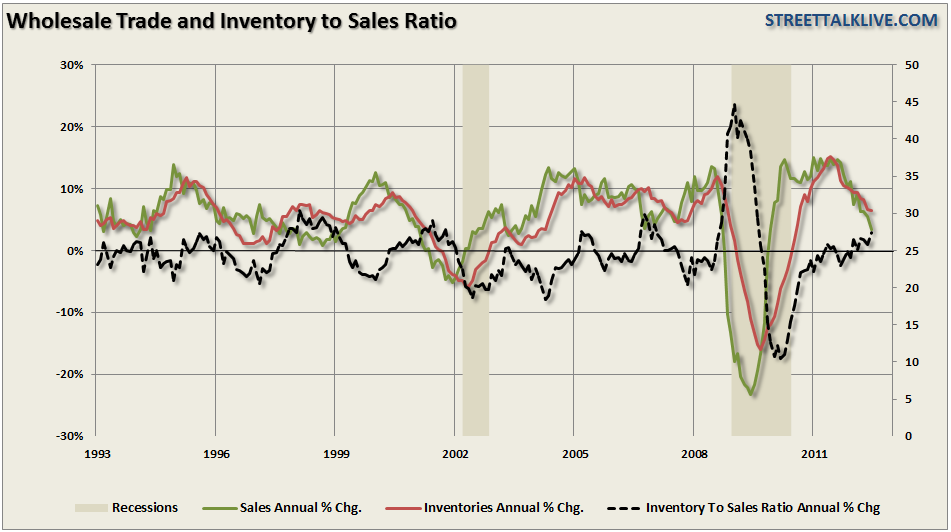
The wholesale trade data, as well as the inventory to sales ratio, showed the weakness on the consumption side of the economic equation. For the latest month sales fell almost 3.5% on a year over year basis. This was far worse than expected by most economists but the slowdown in consumption is something that we have been warning about for the last several months.
More importantly, the slow down in sales (consumption) has led to an unwanted rise in inventories of 6.5% annualized. Increases in inventories are troubling as ultimately producers will become more defensive by liquidating excesses, idling back production and reducing employment. This obviously does not bode well for either GDP growth, or employment, in the future.
The chart shows the annual change in sales, inventories and the inventory to sales ratio. With the inventory to sales ratio rising towards historical peaks, combined with the sharp slow down in sales, we are likely going to see weakness in upcoming manufacturing reports.
Trade Deficit - The Best We Will See This Year
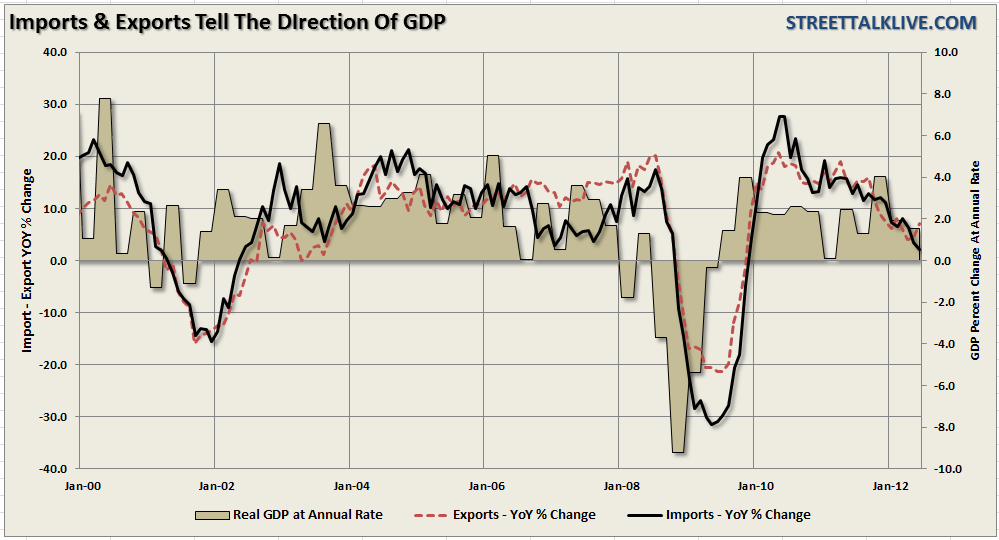
The good news is that the U.S. trade balance in June shrank again thanks primarily to a stronger U.S. dollar, due to the Eurocrisis, and lower oil prices. The deficit was also reduced by a drop in imports which is reflective of the drop in consumer demand. In the most recent release the trade deficit decreased to $42.9 billion from $48.0 billion in May (originally $48.7 billion). Exports advanced 0.9 percent, following a 0.3 percent rise in May. Imports shrank 1.5 percent after a 0.8 percent decrease in May.
There are pluses and minuses in the detail. The big plus is that exports were positive but the bad news is that the annual rate of change has continued to slow which, with exports making up 40% of corporate profits since the last recession, is why we see corporate earnings, and particularly revenue, showing signs of strain. The big negative is the continued deceleration in imports, excluding petroleum, which continues to support the softness in demand in consumer and business spending.
With oil prices surging in the latest month, and the dollar retracing some of the recent gains on expectations that Draghi will come through and save the Euro, the trade deficit will reverse course next month. What we will want to watch is the trend of exports as it will provide direction for expectations of corporate earnings growth while imports will continue to show the underlying strength of the consumer.
Consumer Credit
Speaking of consumption the consumer has officially given up trying to deleverage their balance sheet. When the financial crisis, and recession, took hold in 2008 through 2009 the consumer began to deleverage their balance sheet. However, most of this deleveraging was done by force through write-offs, bankruptcies, foreclosures, default, etc. but as of 2010 that has now ended and the consumer is back to ramping up debt again.
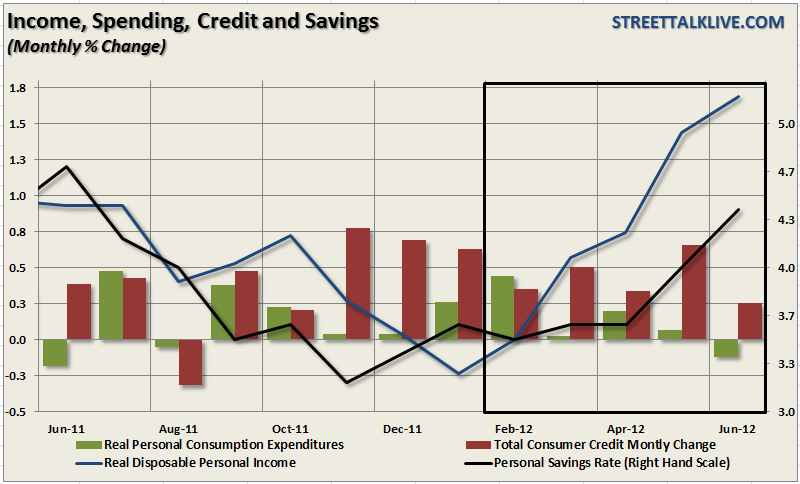
Normally, this would be a good thing. Increases in credit historically have led to more consumption which then increases demand on businesses who in turn create more employment which further increases demand. It is in this environment that economic growth blossoms. The problem today is that increases in income and credit are not leading to further increases in consumption as the consumer struggles to maintain their current standard of living.
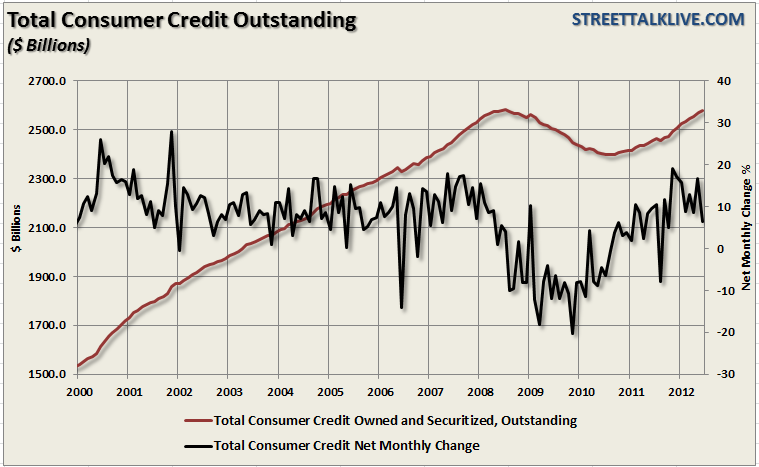
With incomes and wages stagnant over the last couple of years, as inflationary pressures have risen and employment has remained weak, incomes have been bolstered through increased dependency on governmental support programs. Disability claims, food stamps, student loans have all skyrocketed in the last three years as more Americans find themselves struggling to survive. If you look at the second chart you see a steady decline in personal consumption expenditures even as consumer credit has increased. This is clearly a sign that, even while incomes have risen in recent months, the cost of living is absorbing all of it and more.
This leads back to the worries stated above on sales, inventories and imports. With consumption soft businesses retrench to protect profit margins. Businesses initially work through order backlogs as new order declines but eventually have to start idling back on production and employment if demand doesn't strengthen. The dependency on increasing productivity, and keeping wage costs suppressed, have been the weapons of choice in combating weak consumer demand.
Productivity And Labor Costs
Productivity growth for the second quarter improved despite a slowing in output as businesses continue to squeeze as much as possible from current employees. Not only did productivity increase at an annualized 1.6 percent - Unit labor costs decelerated to 1.7 percent annualized. Working harder, and earning less, has been a common theme since the end of the last recession.
There are a couple of ways to look at the data. First, there is a level where businesses have squeezed out all the labor costs possible and that companies must hire to do more business. Of course, that is dependent on there being enough end demand to warrant increases in current production which is the competing viewpoint. From our view, when looking at the trend of sales, consumption, income and credit is that demand (output) is still too sluggish and improvement in job gains will not take place until demand increases.
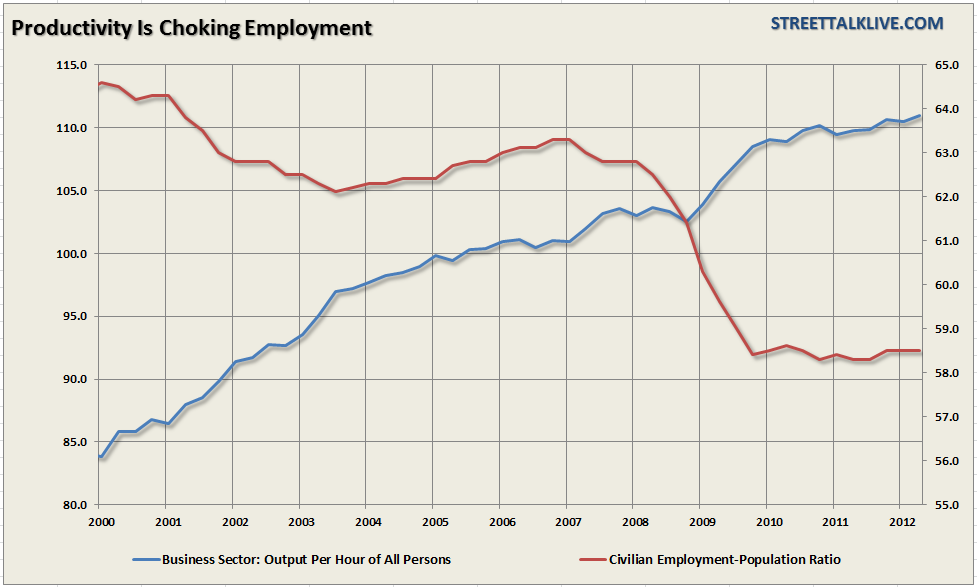
Overall the trends of the data, while not immediately recessionary, do point towards a weaker economy over the next couple of quarters. As will all data - the reports will continue to ebb and flow with intermittent pops in the data that will set the media abuzz, however, it is the overall trends of the data in recent months that tell the real story.
Very likely the data is not weak enough at this point to spur the Fed into action in the next couple of months which is likely to be disappointing for the markets which are currently hanging on to "QE Hopes" in September. However, with inflationary pressures rising from food and energy prices this is likely also to keep the Fed on the sidelines for now as QE programs have immediately spiked commodity prices in the past which has applied further pressure on the consumer.
With the fundamental back drop showing signs of weakness along with the economy the "hope" driven rally would seem to have a fairly limited life span. However, we are in the midst of an election year and the seasonal strong period of the year approaches. It will likely pay to remain cautious over the next couple of months and watch for an entry point to increase equity related exposure in portfolios sometime in September or early October. We will watch our signals and make recommendations accordingly.
Wholesale Trade
The wholesale trade data, as well as the inventory to sales ratio, showed the weakness on the consumption side of the economic equation. For the latest month sales fell almost 3.5% on a year over year basis. This was far worse than expected by most economists but the slowdown in consumption is something that we have been warning about for the last several months.
More importantly, the slow down in sales (consumption) has led to an unwanted rise in inventories of 6.5% annualized. Increases in inventories are troubling as ultimately producers will become more defensive by liquidating excesses, idling back production and reducing employment. This obviously does not bode well for either GDP growth, or employment, in the future.
The chart shows the annual change in sales, inventories and the inventory to sales ratio. With the inventory to sales ratio rising towards historical peaks, combined with the sharp slow down in sales, we are likely going to see weakness in upcoming manufacturing reports.
3rd party Ad. Not an offer or recommendation by Investing.com. See disclosure here or remove ads.

Trade Deficit - The Best We Will See This Year
The good news is that the U.S. trade balance in June shrank again thanks primarily to a stronger U.S. dollar, due to the Eurocrisis, and lower oil prices. The deficit was also reduced by a drop in imports which is reflective of the drop in consumer demand. In the most recent release the trade deficit decreased to $42.9 billion from $48.0 billion in May (originally $48.7 billion). Exports advanced 0.9 percent, following a 0.3 percent rise in May. Imports shrank 1.5 percent after a 0.8 percent decrease in May.
There are pluses and minuses in the detail. The big plus is that exports were positive but the bad news is that the annual rate of change has continued to slow which, with exports making up 40% of corporate profits since the last recession, is why we see corporate earnings, and particularly revenue, showing signs of strain. The big negative is the continued deceleration in imports, excluding petroleum, which continues to support the softness in demand in consumer and business spending.
With oil prices surging in the latest month, and the dollar retracing some of the recent gains on expectations that Draghi will come through and save the Euro, the trade deficit will reverse course next month. What we will want to watch is the trend of exports as it will provide direction for expectations of corporate earnings growth while imports will continue to show the underlying strength of the consumer.
3rd party Ad. Not an offer or recommendation by Investing.com. See disclosure here or remove ads.

Consumer Credit
Speaking of consumption the consumer has officially given up trying to deleverage their balance sheet. When the financial crisis, and recession, took hold in 2008 through 2009 the consumer began to deleverage their balance sheet. However, most of this deleveraging was done by force through write-offs, bankruptcies, foreclosures, default, etc. but as of 2010 that has now ended and the consumer is back to ramping up debt again.
Normally, this would be a good thing. Increases in credit historically have led to more consumption which then increases demand on businesses who in turn create more employment which further increases demand. It is in this environment that economic growth blossoms. The problem today is that increases in income and credit are not leading to further increases in consumption as the consumer struggles to maintain their current standard of living.

With incomes and wages stagnant over the last couple of years, as inflationary pressures have risen and employment has remained weak, incomes have been bolstered through increased dependency on governmental support programs. Disability claims, food stamps, student loans have all skyrocketed in the last three years as more Americans find themselves struggling to survive. If you look at the second chart you see a steady decline in personal consumption expenditures even as consumer credit has increased. This is clearly a sign that, even while incomes have risen in recent months, the cost of living is absorbing all of it and more.
3rd party Ad. Not an offer or recommendation by Investing.com. See disclosure here or remove ads.
This leads back to the worries stated above on sales, inventories and imports. With consumption soft businesses retrench to protect profit margins. Businesses initially work through order backlogs as new order declines but eventually have to start idling back on production and employment if demand doesn't strengthen. The dependency on increasing productivity, and keeping wage costs suppressed, have been the weapons of choice in combating weak consumer demand.

Productivity And Labor Costs
Productivity growth for the second quarter improved despite a slowing in output as businesses continue to squeeze as much as possible from current employees. Not only did productivity increase at an annualized 1.6 percent - Unit labor costs decelerated to 1.7 percent annualized. Working harder, and earning less, has been a common theme since the end of the last recession.
There are a couple of ways to look at the data. First, there is a level where businesses have squeezed out all the labor costs possible and that companies must hire to do more business. Of course, that is dependent on there being enough end demand to warrant increases in current production which is the competing viewpoint. From our view, when looking at the trend of sales, consumption, income and credit is that demand (output) is still too sluggish and improvement in job gains will not take place until demand increases.

Overall the trends of the data, while not immediately recessionary, do point towards a weaker economy over the next couple of quarters. As will all data - the reports will continue to ebb and flow with intermittent pops in the data that will set the media abuzz, however, it is the overall trends of the data in recent months that tell the real story.
3rd party Ad. Not an offer or recommendation by Investing.com. See disclosure here or remove ads.
Very likely the data is not weak enough at this point to spur the Fed into action in the next couple of months which is likely to be disappointing for the markets which are currently hanging on to "QE Hopes" in September. However, with inflationary pressures rising from food and energy prices this is likely also to keep the Fed on the sidelines for now as QE programs have immediately spiked commodity prices in the past which has applied further pressure on the consumer.
With the fundamental back drop showing signs of weakness along with the economy the "hope" driven rally would seem to have a fairly limited life span. However, we are in the midst of an election year and the seasonal strong period of the year approaches. It will likely pay to remain cautious over the next couple of months and watch for an entry point to increase equity related exposure in portfolios sometime in September or early October. We will watch our signals and make recommendations accordingly.
Which stock should you buy in your very next trade?
AI computing powers are changing the stock market. Investing.com's ProPicks AI includes 6 winning stock portfolios chosen by our advanced AI. In 2024 alone, ProPicks AI identified 2 stocks that surged over 150%, 4 additional stocks that leaped over 30%, and 3 more that climbed over 25%. Which stock will be the next to soar?
Unlock ProPicks AI