Stock market today: S&P 500 slips as Trump’s tariff salvo sours sentiment
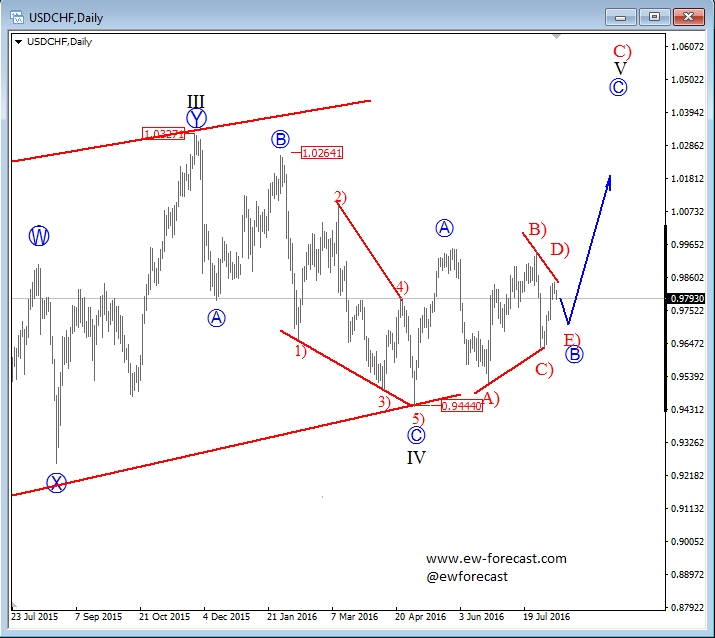
USD/CHF has made a big pullback since end of 2015 that we see it as a corrective and temporary decline. Notice that falling price action was overlapping; thus it has evidence of a contra-trend movement so we suspect that downtrend is finished now, especially after we identified an ending diagonal in wave C-circled of a big wave IV. Ideally market is now making a new bullish turn up into wave V that should be made by three waves. If we are correct then current triangle represents wave B-circled that can send price up into wave C later this summer.
USD/CHF, Daily
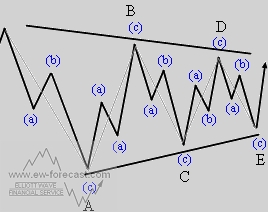
A Triangle is a common 5 wave pattern labelled A-B-C-D-E that moves counter-trend and is corrective in nature. Triangles move within two channel lines drawn from waves A to C, and from waves B to D. A Triangle is either contracting or expanding depending on whether the channel lines are converging or expanding. Triangles are overlapping five wave affairs that subdivide 3-3-3-3-3.
A Basic triangle correction:


