Get 40% Off
🚨 Volatile Markets? Find Hidden Gems for Serious OutperformanceFind Stocks Now

Edge Breakouts For Indices; Russell 2000 Continues To Underperform

Published 08/04/2020, 12:21 AM

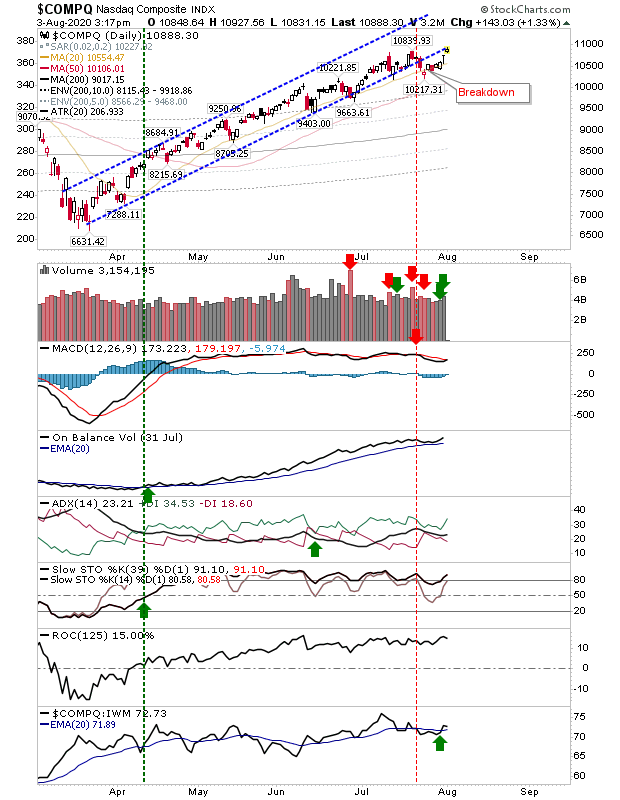
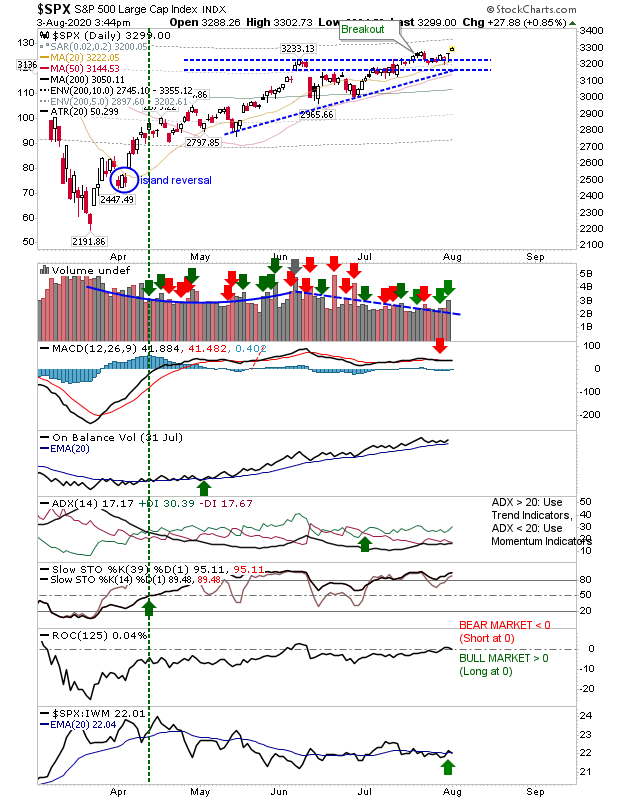
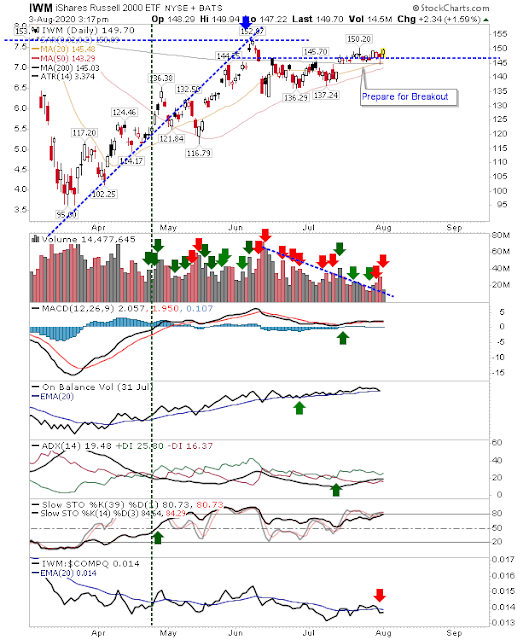
It wasn't a major move but buyers were able to push new highs yesterday, nicking breakouts for the S&P and NASDAQ, but not yet the Russell 2000. I would like to see more volume with the move and ideally, a large white candlestick. 

The NASDAQ rallied to former channel support, now resistance. The technical picture has stayed positive even when the rally moved outside of its rising channel. Aggressive players could look for a short. 
Nasdaq Composirte Index Chart

The S&P has a similar set-up and technical picture as the NASDAQ. Good technical strength but the breakout lacked oomph.
S&P 500 Large Cap Index Chart

The Russell 2000 (via iShares Russell 2000 ETF (NYSE:IWM)) is the index in greatest need of a breakout and yesterday's buying was decent, but trading volume was light and the index is underperforming its peers. Traders could a long position and put the stop below Friday's low (from the 'hammer').
IWM Daily Chart

Today, look for some follow through. Indices need to put some distance from support to encourage momentum trader participation. The market is drifting with breadth metrics building bearish divergences. 

Latest comments

Risk Disclosure: Trading in financial instruments and/or cryptocurrencies involves high risks including the risk of losing some, or all, of your investment amount, and may not be suitable for all investors. Prices of cryptocurrencies are extremely volatile and may be affected by external factors such as financial, regulatory or political events. Trading on margin increases the financial risks.
Before deciding to trade in financial instrument or cryptocurrencies you should be fully informed of the risks and costs associated with trading the financial markets, carefully consider your investment objectives, level of experience, and risk appetite, and seek professional advice where needed.
Fusion Media would like to remind you that the data contained in this website is not necessarily real-time nor accurate. The data and prices on the website are not necessarily provided by any market or exchange, but may be provided by market makers, and so prices may not be accurate and may differ from the actual price at any given market, meaning prices are indicative and not appropriate for trading purposes. Fusion Media and any provider of the data contained in this website will not accept liability for any loss or damage as a result of your trading, or your reliance on the information contained within this website.
It is prohibited to use, store, reproduce, display, modify, transmit or distribute the data contained in this website without the explicit prior written permission of Fusion Media and/or the data provider. All intellectual property rights are reserved by the providers and/or the exchange providing the data contained in this website.
Fusion Media may be compensated by the advertisers that appear on the website, based on your interaction with the advertisements or advertisers.
© 2007-2024 - Fusion Media Limited. All Rights Reserved.