Stock market today: S&P 500 ekes out gain as Trump says open to deals on tariffs
Canada – The economic calendar was light this week. In 2012Q1, capacity utilization increased 0.2 percentage point to 80.7%. This was one percentage point higher than 12 months earlier but still four points below the average level for the period from 1999Q4 to 2007Q2. While capacity utilization was up in 13 of the 21 major manufacturing industries, it was down in a majority of the non-manufacturing sectors for a second straight quarter.
In April, manufacturing shipments were weaker than expected, falling 0.8% to $49.1 billion. Our forecast was for a 0.6% decline while the consensus was for a 0.2% gain. Sales declined in 13 of the 21 industries. Year-to-date manufacturing sales shrank in three of the four months ending with April. In constant dollars, sales sank 0.6%. Seven of the ten provinces saw sales pull back. Given the 33.7% decrease in production of aerospace products and parts, it is not surprising that Quebec posted the largest drop ($445 million) in dollar terms. Ontario ($535 million), Saskatchewan ($23 million) and Newfoundland ($45 million) were the three provinces with higher sales in the month.
United States – In May, import prices fell as expected. Led by a sharp decline in fuel prices (-4.2%), total import prices were down 1.0% from the month before, which pulled the 12-month rate of change into negative territory (-0.3%) for the first time since October 2009. Excluding petroleum, import prices were up 0.3% from May 2011. This was the smallest year-over-year increase since December 2009. The producer price index for finished goods dropped 1.0% in the month on the back of lower energy and food prices. Intermediate goods prices contracted 0.8% while core intermediate goods shrank more modestly (-0.2%).
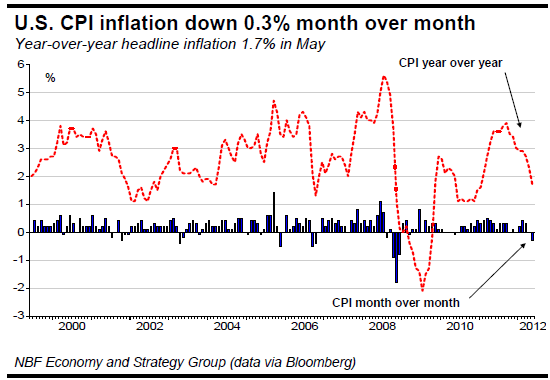
The set of receding monthly inflation indicators extended to the all-items CPI, which slipped 0.3% (s.a) in the month. Contributing to the decline was a steep drop in the gasoline price index, which fell 6.8%. Food prices were unchanged. Over the past 12 months, the all-items CPI increased 1.7%. This compares with an increase of 3.6% for the same month the previous year. Core inflation, which excludes food and energy, rose 0.2% in the month, leaving the 12-month rate of change at 2.3%.

Still in May, headline retail sales slipped 0.2%, while April’s figure was revised down three ticks to -0.2%. Declining gasoline prices and lower building material sales contributed to the poor result in May. Excluding gasoline, autos and building materials, core sales were flat in the month, following a downwardly revised gain of 0.1% in April (originally reported at 0.4%). Gains in motor vehicles (0.8%), clothing (0.9%) and electronics (0.8%) helped counter the combination of April’s downward revisions and May’s softness.
Again in May, industrial production shrank 0.1%. The prior month’s figure was revised down a tick to +1%. Capacity utilization slid two ticks to 79% after reaching a four-year high the prior month. The drag on IP came from manufacturing output, which decreased 0.4% as output in the auto sector contracted. Mining output climbed 0.9% while utilities output sprang 0.8% after surging 5% the preceding month. May's IP report was soft, although it should be noted that this came after a strong April. Industrial output grew at an annualized 5.6% in 2012Q1 and is now tracking at roughly 2.9% in the current quarter.
This heralds another U.S. GDP print below 2% for 2012Q2.
In other news, business inventories swelled 0.4% in April. The inventory-to-sales ratio held steady while total business sales increased modestly (0.2%). Also, the preliminary read on the Michigan consumer sentiment index for June showed a drop of more than five points to 74.1. The decline is not overly surprising in light of growing economic uncertainty fanned by a worsening of the European crisis and soft U.S. data (including with respect to employment).
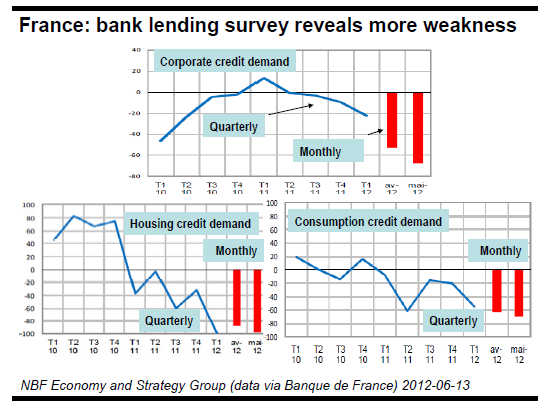
Euro area – The monthly banking survey published by the Bank of France did nothing to muster optimism about the nation’s economic state of affairs. According to the survey, 70.6% of senior loan officers reported weaker credit demand from corporations in May. Only 3.2% reported stronger demand, which made for a net reading of -67.4. This marks a significant deterioration from April, when the reading came in at -52.8. The situation was even worse in regard to credit demand for housing, which registered a net reading of -97.5. Consumption credit demand deteriorated as well. While hard data on France’s economic performance in 2012Q2 are still sparse, qualitative data are clearly pointing to a worsening of economic conditions in the country.

In April, manufacturing shipments were weaker than expected, falling 0.8% to $49.1 billion. Our forecast was for a 0.6% decline while the consensus was for a 0.2% gain. Sales declined in 13 of the 21 industries. Year-to-date manufacturing sales shrank in three of the four months ending with April. In constant dollars, sales sank 0.6%. Seven of the ten provinces saw sales pull back. Given the 33.7% decrease in production of aerospace products and parts, it is not surprising that Quebec posted the largest drop ($445 million) in dollar terms. Ontario ($535 million), Saskatchewan ($23 million) and Newfoundland ($45 million) were the three provinces with higher sales in the month.
United States – In May, import prices fell as expected. Led by a sharp decline in fuel prices (-4.2%), total import prices were down 1.0% from the month before, which pulled the 12-month rate of change into negative territory (-0.3%) for the first time since October 2009. Excluding petroleum, import prices were up 0.3% from May 2011. This was the smallest year-over-year increase since December 2009. The producer price index for finished goods dropped 1.0% in the month on the back of lower energy and food prices. Intermediate goods prices contracted 0.8% while core intermediate goods shrank more modestly (-0.2%).
3rd party Ad. Not an offer or recommendation by Investing.com. See disclosure here or remove ads.
The set of receding monthly inflation indicators extended to the all-items CPI, which slipped 0.3% (s.a) in the month. Contributing to the decline was a steep drop in the gasoline price index, which fell 6.8%. Food prices were unchanged. Over the past 12 months, the all-items CPI increased 1.7%. This compares with an increase of 3.6% for the same month the previous year. Core inflation, which excludes food and energy, rose 0.2% in the month, leaving the 12-month rate of change at 2.3%.

Still in May, headline retail sales slipped 0.2%, while April’s figure was revised down three ticks to -0.2%. Declining gasoline prices and lower building material sales contributed to the poor result in May. Excluding gasoline, autos and building materials, core sales were flat in the month, following a downwardly revised gain of 0.1% in April (originally reported at 0.4%). Gains in motor vehicles (0.8%), clothing (0.9%) and electronics (0.8%) helped counter the combination of April’s downward revisions and May’s softness.
Again in May, industrial production shrank 0.1%. The prior month’s figure was revised down a tick to +1%. Capacity utilization slid two ticks to 79% after reaching a four-year high the prior month. The drag on IP came from manufacturing output, which decreased 0.4% as output in the auto sector contracted. Mining output climbed 0.9% while utilities output sprang 0.8% after surging 5% the preceding month. May's IP report was soft, although it should be noted that this came after a strong April. Industrial output grew at an annualized 5.6% in 2012Q1 and is now tracking at roughly 2.9% in the current quarter.
3rd party Ad. Not an offer or recommendation by Investing.com. See disclosure here or remove ads.
This heralds another U.S. GDP print below 2% for 2012Q2.
In other news, business inventories swelled 0.4% in April. The inventory-to-sales ratio held steady while total business sales increased modestly (0.2%). Also, the preliminary read on the Michigan consumer sentiment index for June showed a drop of more than five points to 74.1. The decline is not overly surprising in light of growing economic uncertainty fanned by a worsening of the European crisis and soft U.S. data (including with respect to employment).
Euro area – The monthly banking survey published by the Bank of France did nothing to muster optimism about the nation’s economic state of affairs. According to the survey, 70.6% of senior loan officers reported weaker credit demand from corporations in May. Only 3.2% reported stronger demand, which made for a net reading of -67.4. This marks a significant deterioration from April, when the reading came in at -52.8. The situation was even worse in regard to credit demand for housing, which registered a net reading of -97.5. Consumption credit demand deteriorated as well. While hard data on France’s economic performance in 2012Q2 are still sparse, qualitative data are clearly pointing to a worsening of economic conditions in the country.

Which stock should you buy in your very next trade?
With valuations skyrocketing in 2024, many investors are uneasy putting more money into stocks. Unsure where to invest next? Get access to our proven portfolios and discover high-potential opportunities.
In 2024 alone, ProPicks AI identified 2 stocks that surged over 150%, 4 additional stocks that leaped over 30%, and 3 more that climbed over 25%. That's an impressive track record.
With portfolios tailored for Dow stocks, S&P stocks, Tech stocks, and Mid Cap stocks, you can explore various wealth-building strategies.
