Stock market today: S&P 500 in weekly loss as trade war fears intensifyy
The ECB didn’t introduce new measures at its final meeting in 2014, despite the petering Eurozone economy. The Governing Council decided to reassess the success of its existing stimulus programs in early 2015 along with the impact of weak oil prices on the Eurozone economy. The ECB staff cut growth and inflation forecasts for one more time. The new projections however, don’t include the currently prevailing oil prices. which mean they can be revised further down. It now expects inflation to be just 1.3% in 2016, which could put EUR under pressure.
Later in the question and answer session, President Draghi said that there is no need for unanimity to launch sovereign QE. On the other hand, he didn’t discuss on what kind of majority would be needed to launch a QE as it is pointless he said, to speculate what sort of majority will actually happen to be in place at the time when they decide. In discussing the possibility for additional easing measures, Draghi said that the board considered a wide range of assets, except gold. In answer to a question on why the ECB isn’t taking action, Draghi said that that the Bank needs time to assess the impact of the recent vast oil price changes, and that the stimulus measures taken in recent months haven’t had their full effect yet.
Thus, the Council will take its time before considering new policies. EUR/USD firmed up on the disappointment that no decisions were taken on QE and due to a less dovish stance by the ECB Draghi compared to his speech to the European Banking Congress, where he called inflation “excessively low”. Despite the move higher, we keep our long-term bearish euro view and could see the current rebound as providing renewed selling opportunity.
As for today’s events: the spotlight will be on the US nonfarm payrolls for November. The market consensus is for an increase in payrolls of 230k, up from the unexpectedly low increase of 214k in October. At the same time the unemployment rate is forecast to have remained unchanged at 5.8%, while average hourly earnings are expected to accelerate on a yoy basis. A figure above 200k will mark the 10th consecutive time of job gains over 200k. Such figures would be consistent with the FOMC view of a gradually improving labor market and could push up Fed funds rate expectations, thereby supporting the US Dollar. The country’s trade balance and factory orders, both for October are also coming out.
In Eurozone, the final Q3 GDP is forecast to confirm the preliminary figure and show a rise of 0.2% qoq. This will add to the growing body of evidence of a slowdown in the Eurozone recovery.
In Sweden, industrial production for October is expected to rise, a turnaround from the previous month.
In Norway, industrial production for October is to be released, but no forecast is available.
From Canada, we get the employment report for November. The forecast is for the unemployment rate to increase a bit, while the net change in employment is expected to drop to 0.0k from 43.1k the previous month. The October and September gains in jobs, marked the first time since November 2013 that the roller-coaster jobs report recorded two successive month of employment growth. Thus the switching pattern no longer holds.
As for the speakers, Cleveland Fed President Loretta Mester and Fed Vice Chairman Stanley Fischer speak.
The Market
EUR/USD shoots up on Draghi’s comments
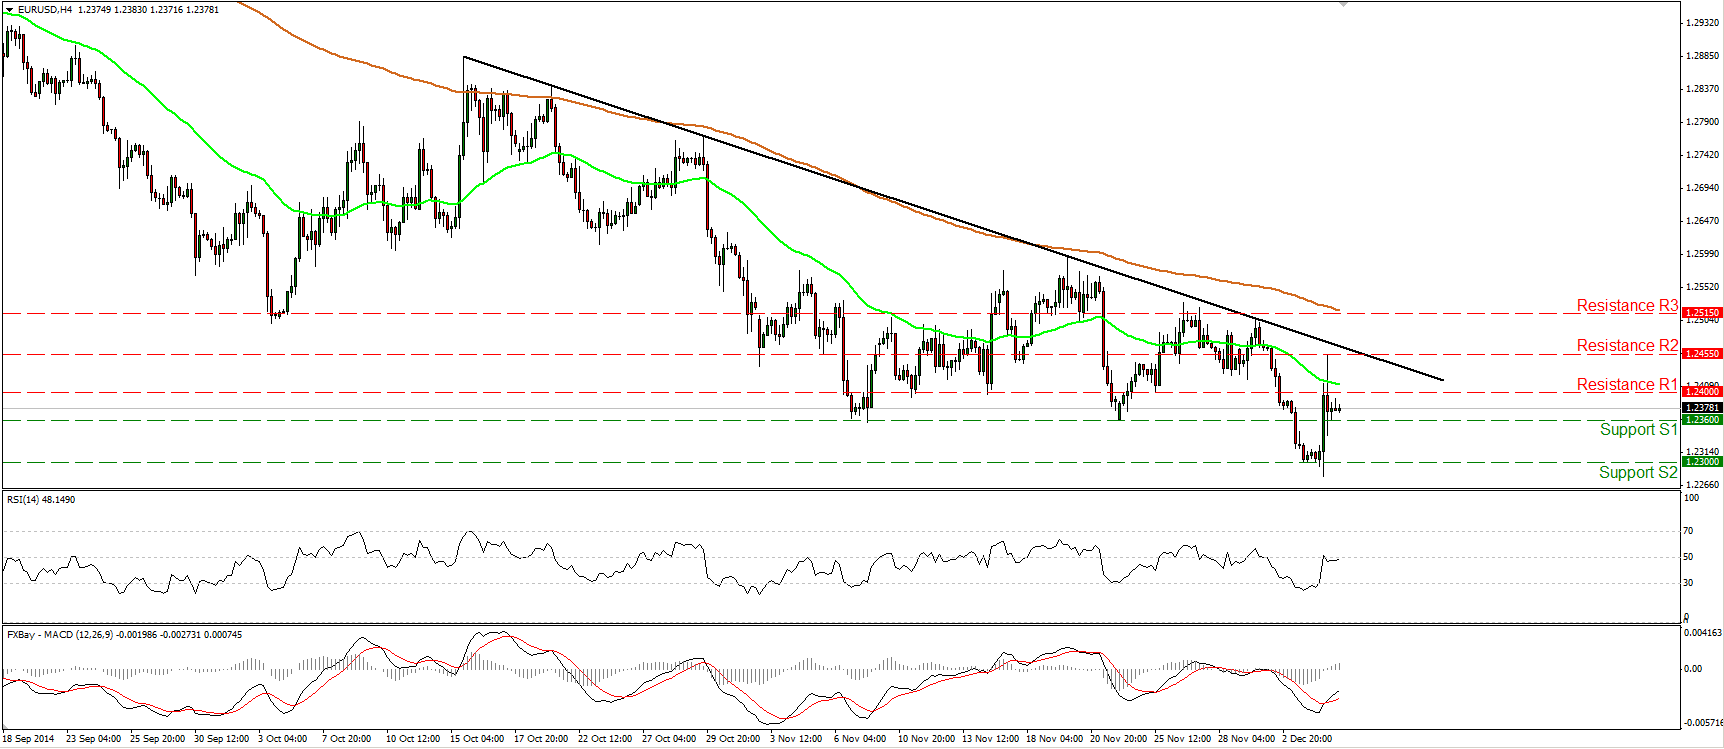
EUR/USD surged on Thursday after ECB President Draghi said that the Bank will wait until next quarter to asses if additional stimulus measures are needed. However, the rally was stopped at 1.2455 (R2) and subsequently the pair moved lower to trade again near the 1.2360 (S1) obstacle. As long as the rate stays below the black downtrend line taken from back the high of the 15th of October, I would stick to the view that the near-term picture stays negative. Today, we get the US non-farm payrolls for November, which are expected to rise by more than in the previous month. This could cause another dip below the 1.2360 (S1) line and perhaps pull the trigger for another test near the 1.2300 (S2) zone. On the daily chart, the price structure still suggests a downtrend, thus the overall path of EUR/USD remains to the downside.
• Support: 1.2360 (S1), 1.2300 (S2), 1.2250(S3).
• Resistance: 1.2400 (R1), 1.2455 (R2), 1.2515 (R3).
USD/JPY pokes its nose above 120.00
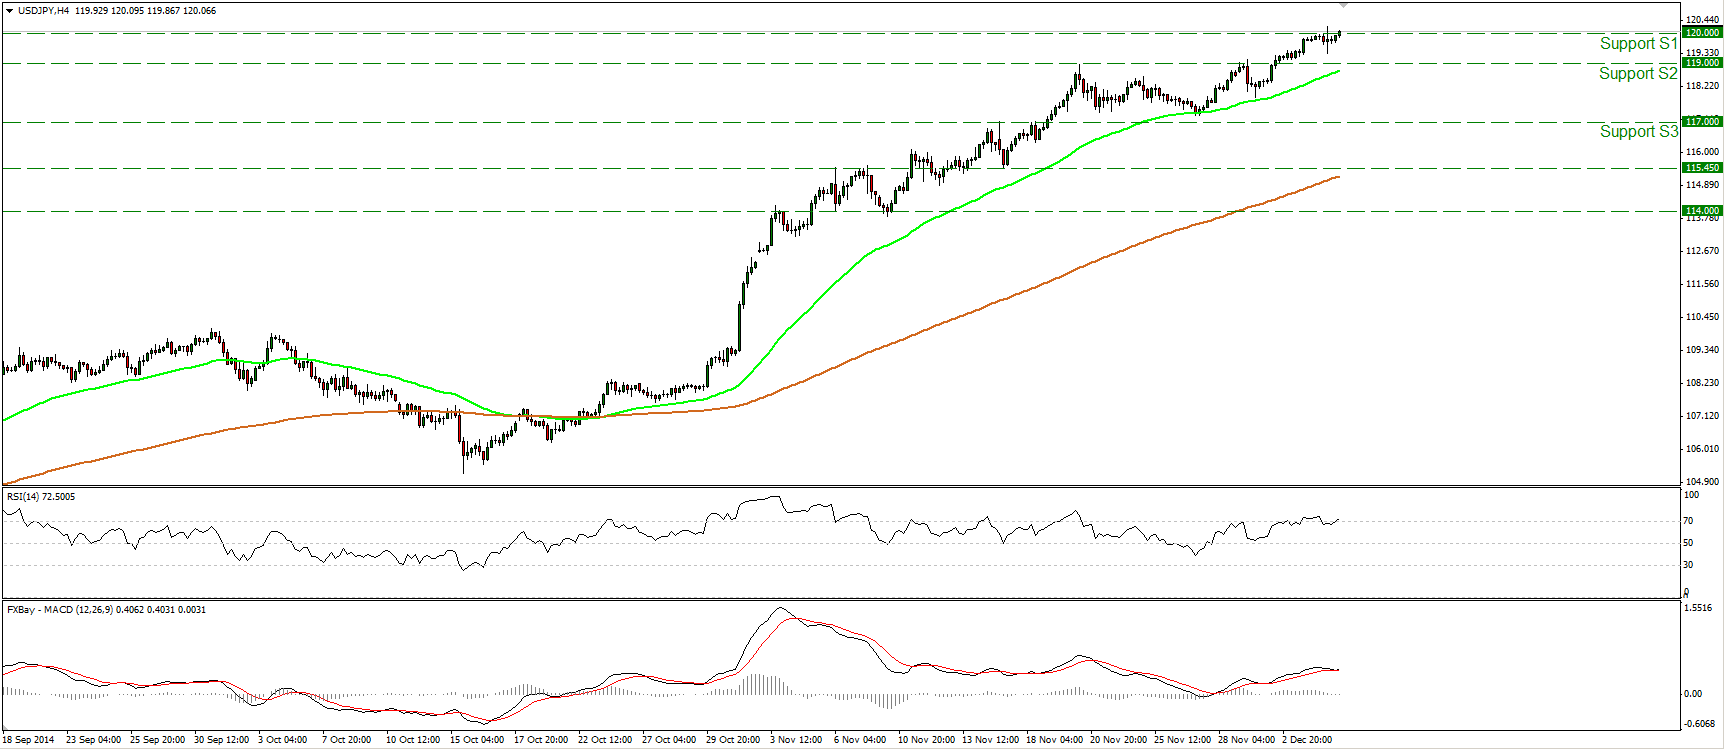
USD/JPY continued rising and on Thursday it managed to poke its nose above the critical barrier of 120.00 (S1), which happens to be the 61.8% retracement level of the 1998-2012 major downtrend. A close above that obstacle could have larger bullish implications and perhaps target the 122.50 (R1) resistance, marked by the high of the 20th of July 2007. Our momentum studies maintain a positive tone as well. The RSI entered again its overbought field, while the MACD stands above both its zero and signal lines. However, the MACD shows some weakness signs. It is pointing down and could move below its signal line any time soon. As a result I would be mindful of a possible pullback before the bulls take the reins again.
• Support: 120.00 (S1), 119.00 (S2), 117.00 (S3).
• Resistance: 122.50 (R1), 124.00 (R2), 125.00 (R3).
GBP/USD finds again resistance near the 1.5735 line
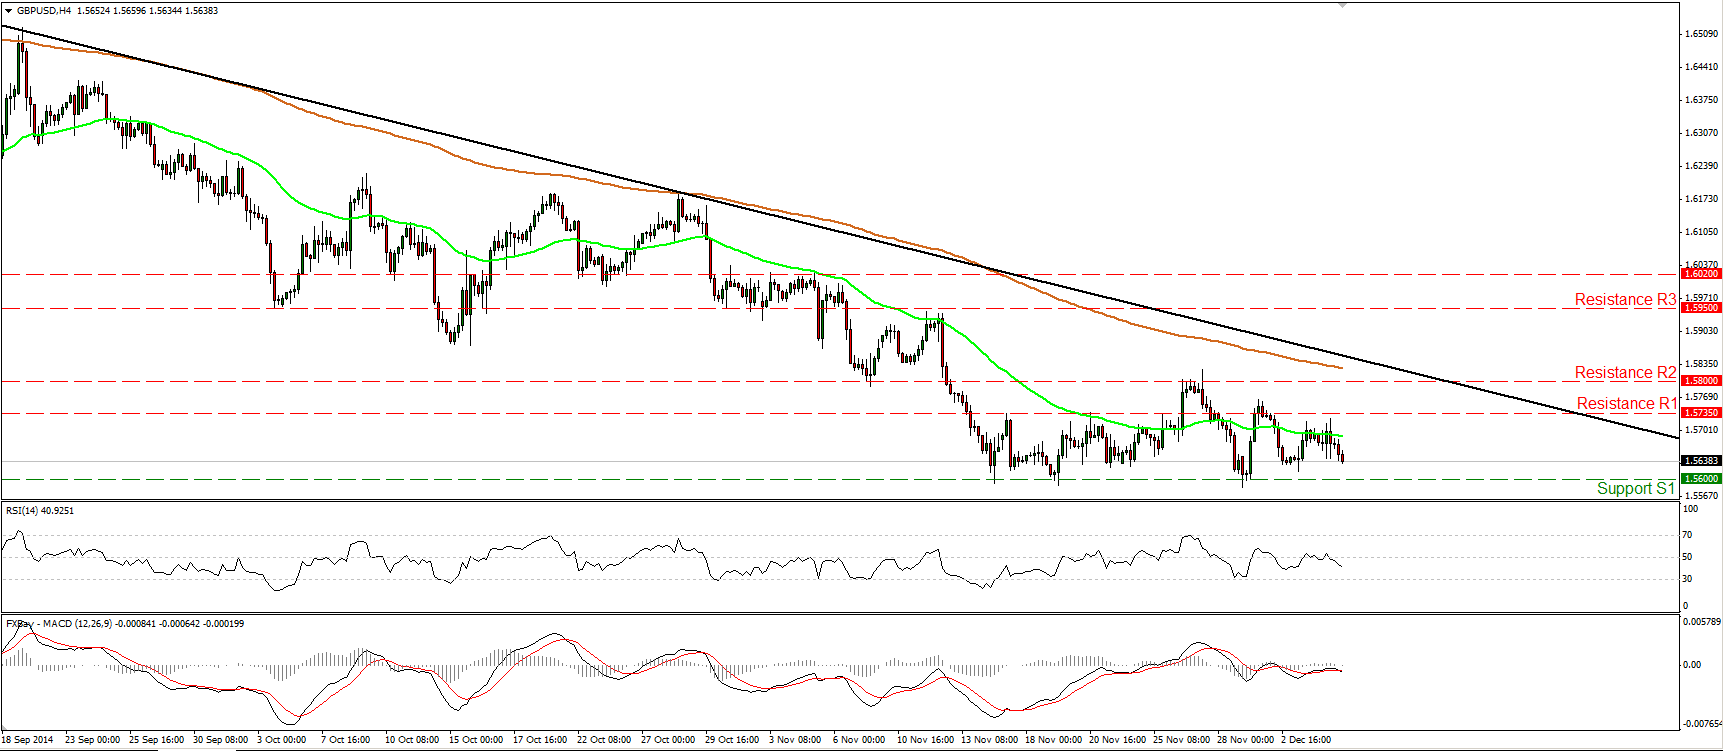
GBP/USD slid after finding resistance slightly below the 1.5735 (R1) resistance line. I would now expect the rate to challenge again the well-tested area of 1.5600 (S1). A clear dip below that line is likely to pull the trigger for the psychological hurdle of 1.5500 (S2). Shifting my attention to our short-term oscillators, I see that the RSI continued declining after falling below its 50 line, while the MACD, already negative, crossed below its trigger line. This designates negative momentum and amplify the case that we are likely to see Cable lower in the near future. As for the broader trend, the price structure remains lower peaks and lower troughs below the 80-day exponential moving average, thus I would consider the overall picture of GBP/USD to stay negative.
• Support: 1.5600 (S1), 1.5500 (S2), 1.5430 (S3).
• Resistance: 1.5735 (R1), 1.5800 (R2), 1.5950 (R3).
WTI a bit lower
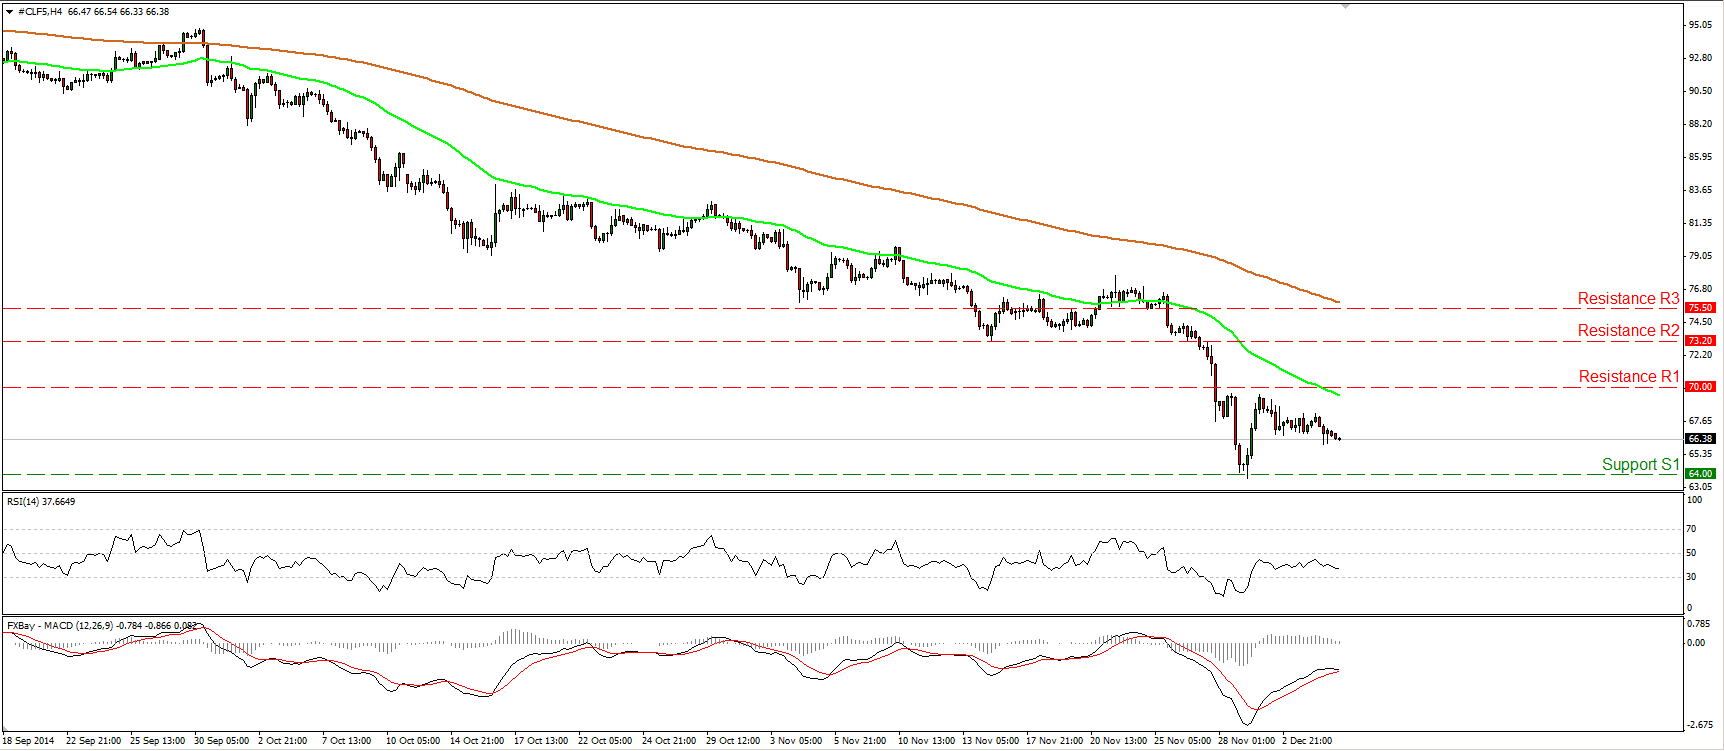
WTI moved somewhat lower yesterday and is currently trading near 66.50 dollars/barrel. The bears seem to have taken back control and therefore, I would expect another test at the support area of 64.00 (S1) in the close future. Our short-term momentum indicators support the notion. The RSI moved lower after finding resistance slightly below its 50 line, while the MACD, already negative, shows signs of topping and could move below its trigger any time soon. On the daily chart, the price structure remains lower peaks and lower troughs below both the 50- and the 200-day moving averages, which keeps the overall path of WTI to the downside.
• Support: 64.00 (S1), 62.70 (S2), 60.00 (S3).
• Resistance: 70.00 (R1), 73.20 (R2), 75.50 (R3).
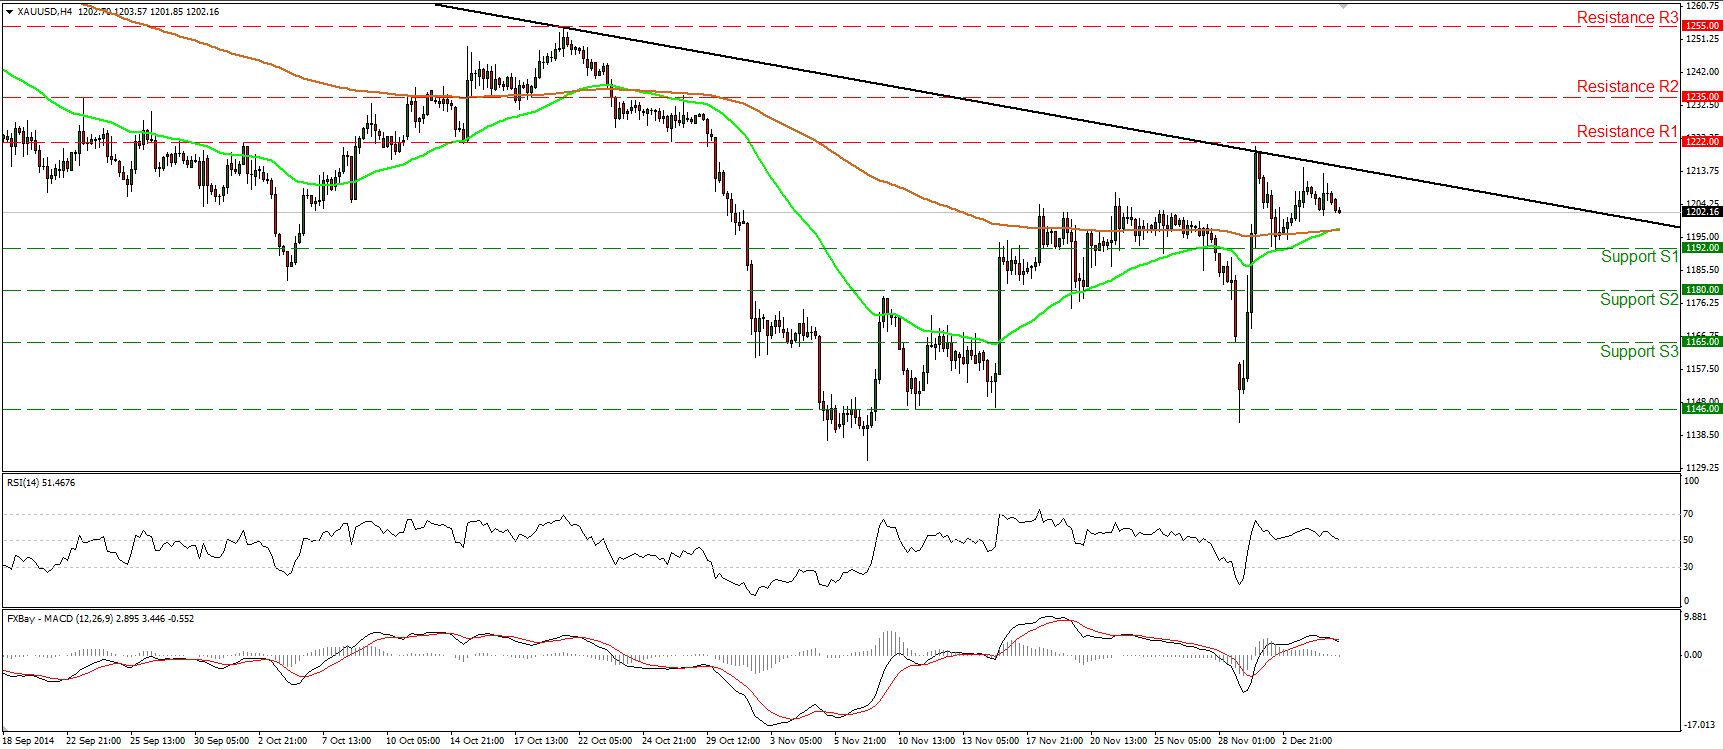
Gold finds resistance again near the trend line
Gold moved lower yesterday after finding again resistance near the black downtrend line taken from back the high of the 10th of July. Our momentum studies suggest that we may experience another test at the 1192 (S1) line in the close future. The RSI declined and reached its 50 line, while the MACD, even though positive, has topped and fell below its signal line. However, with no clear trending conditions in the near term I would prefer to maintain my flat stance for now. On the daily chart, the yellow metal stays below the aforementioned downtrend line, and this keeps the longer-term downtrend intact. Nevertheless, the 14-day RSI stands above its 50 line, while the daily MACD, already above its trigger, poked its nose above its zero line. These momentum signs give me extra reasons to sit on the sidelines, at least for now.
• Support: 1192 (S1), 1180 (S2), 1165 (S3).
• Resistance: 1222 (R1), 1235 (R2), 1255 (R3).
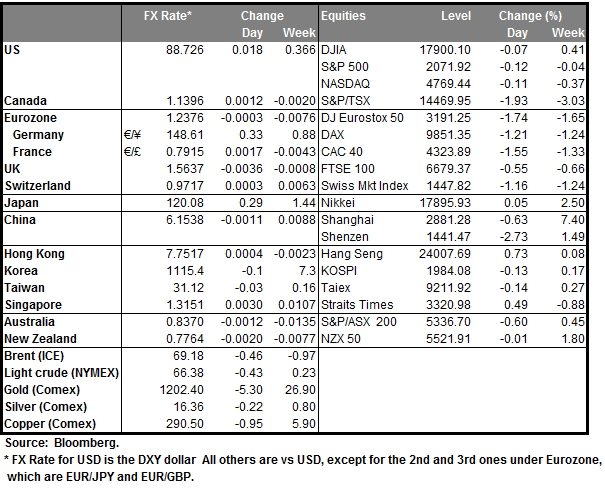
BENCHMARK CURRENCY RATES - DAILY GAINERS AND LOSERS
MARKETS SUMMARY
Which stock should you buy in your very next trade?
With valuations skyrocketing in 2024, many investors are uneasy putting more money into stocks. Unsure where to invest next? Get access to our proven portfolios and discover high-potential opportunities.
In 2024 alone, ProPicks AI identified 2 stocks that surged over 150%, 4 additional stocks that leaped over 30%, and 3 more that climbed over 25%. That's an impressive track record.
With portfolios tailored for Dow stocks, S&P stocks, Tech stocks, and Mid Cap stocks, you can explore various wealth-building strategies.

