• ECB meeting preview: Are the latest measures “adequate”? The European Central Bank is expected to hold fire today, but to maintain the likelihood to react if inflation outlook deteriorates. At their last meeting, the Governing Council reduced the deposit facility rate by 10bps and extended the QE program for at least another 6 months. In the meantime, the Bank expanded the assets it can purchase and decided to reinvest the proceeds from the bonds that mature. Some members of the Governing Council stated recently that they are skeptical about further policy action in the near-term and that they need to monitor the effectiveness of the previous actions first. With the latest stimulus package just above a month old, we don’t expect any change in policy at this meeting. Instead, we believe the Bank will remain on hold in order to assess whether the risks to growth and inflation have risen, following the renewed fall in oil prices. After almost exactly a year when the Bank initiated its asset purchase program, ECB officials are likely to be questioned whether the previous measures are not exerting the desired effects and if more action is likely this year. After having raised expectation too high at the December meeting, ECB Draghi may also be cautious in his choice of language. He could simply stress the Bank’s readiness to act again and keep the door open to use all the tools available within its mandate. The market is already pricing in some further easing this year, despite Draghi describing the latest measures as “adequate”. A change to that language is needed to signal additional measures, and weaken the common currency.
• Bank of Canada holds rates unchanged Bank of Canada officials maintained the overnight rate unchanged at 0.5%, after taking into considerations future fiscal stimulus package and risks associated to the significant decline of the Canadian dollar. In the lead-up to the rate decision, economists were evenly split between a rate cut and on hold stance, while investors on the other hand, had priced in over 80% chance of a cut. As a result, the loonie strengthened in the event despite the renewed drop in oil prices. We believe that if the magnitude of the anticipated fiscal policy disappoints, then we could see further monetary easing. The prospect of further monetary stimulus form the BoC, along with the low oil prices are likely to keep CAD under selling pressure.
• As for today’s indicators from Eurozone, the preliminary consumer confidence for January is forecast to have declined at the same pace as the previous month.
• In the US, initial jobless claims for the week ended on the 15th of January are forecast to have decreased from the previous week, while the 4-week moving average is expected to have increased slightly. The Philadelphia Fed Business activity index is expected to show that business conditions continued to deteriorate in January, but by less than the previous month.
• We only have one speaker scheduled on Thursday: ECB President Mario Draghi will hold a press conference following the interest rate decision.
The Market
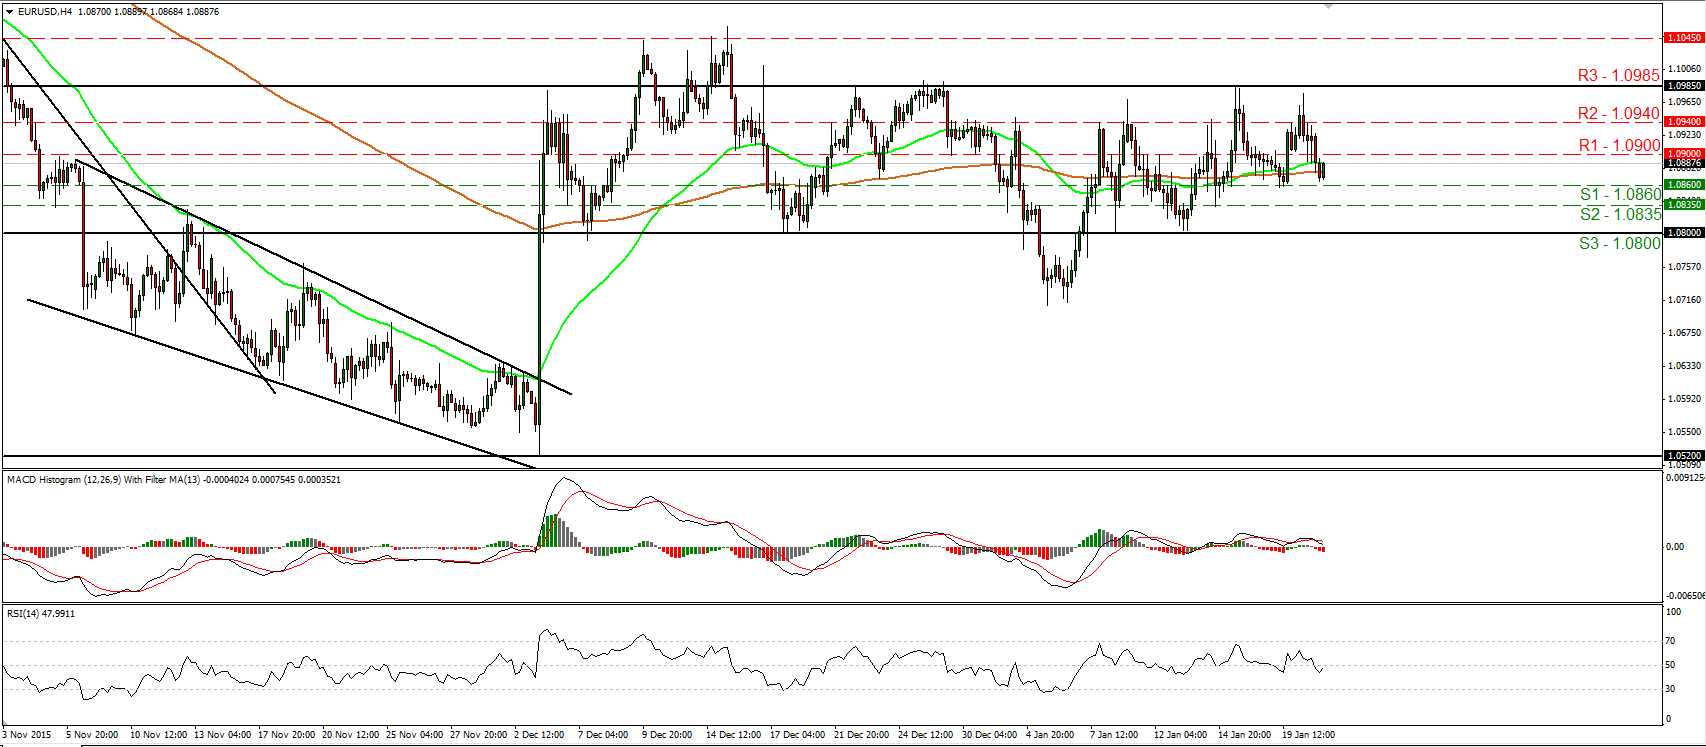
EUR/USD finds again resistance near 1.0985 and slides
• EUR/USD traded lower on Wednesday after it hit resistance slightly below the key obstacle of 1.0985 (R3). However, the decline was stopped slightly above the 1.0860 (S1) support line and then the rate rebounded somewhat. Given that the pair has been oscillating between the 1.0985 (R3) resistance area and the support zone of 1.0800 (S3), I would consider the short-term trend to still be to the sideways. Today, we have an ECB policy meeting, but no change in policy is expected. The focus will be on the press conference held by President Draghi following the decision. If he signals that the Bank stands ready to act again soon, we may see the rate sliding below 1.0860 (S1). Looking at our short-term oscillators, I see that the RSI fell back below its 50 line, while the MACD, although positive, has topped and fallen below its trigger line. These indicators reveal downside momentum. However, the RSI has turned somewhat up, providing evidence that the current corrective bounce may continue for a while. In the bigger picture, I will hold the view that as long as the pair is trading above the key support zone of 1.0800, the medium-term picture stays flat as well.
• Support: 1.0860 (S1), 1.0835 (S2), 1.0800 (S3)
• Resistance: 1.0900 (R1), 1.0940 (R2), 1.0985 (R3)
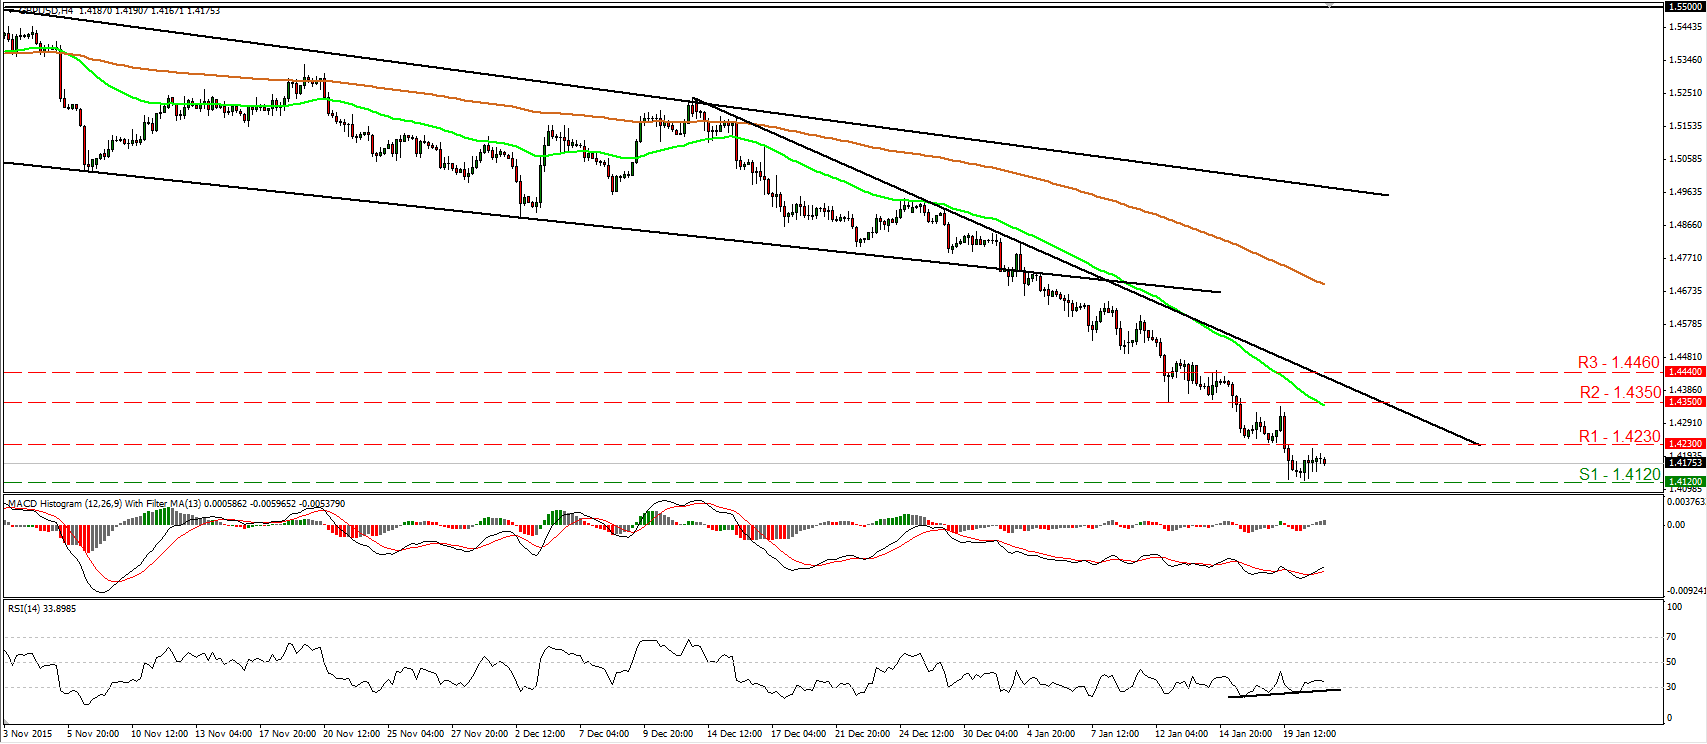
GBP/USD rebounds somewhat from 1.4120
• GBP/USD traded somewhat higher yesterday after it hit support near the 1.4120 (S1) line. However, it hit resistance fractionally below the 1.4230 (R1) line and then it retreated. Cable is still trading below the downtrend line taken from the peak of the 14th of December. Thus, I still consider the short-term picture to be negative and I would treat yesterday’s rebound, or any possible extensions of it, as a corrective move. I believe that at some point, the bears will regain their momentum and push the rate down for another test at 1.4120 (S1). A decisive dip below that level is likely to carry larger bearish extensions and perhaps aim for the psychological zone of 1.4000 (S2). Our short-term oscillators though give evidence that the corrective move is likely to continue for a bit. The RSI exited its below-30 territory, while the MACD has bottomed and crossed above its trigger line. There is also positive divergence between the RSI and the price action. In the bigger picture, the price structure remains lower peaks and lower troughs below the 80-day exponential moving average, which is pointing down. Thus, I still see a negative longer-term picture as well.
• Support: 1.4120 (S1), 1.4000 (S2), 1.3850 (S3)
• Resistance: 1.4230 (R1), 1.4350 (R2), 1.4460 (R3)
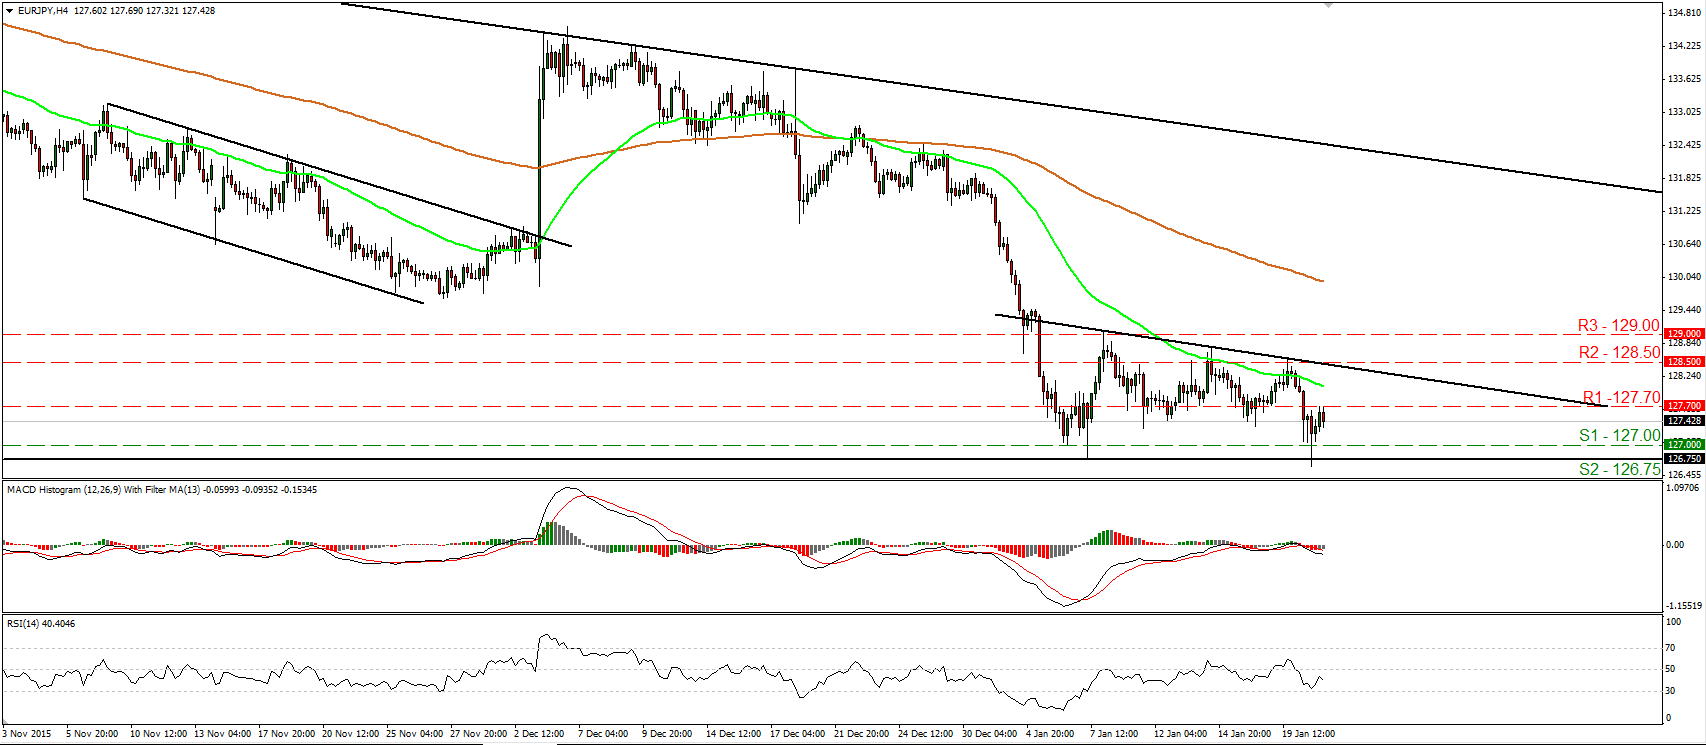
EUR/JPY rebounds once again from near 126.75
• EUR/JPY traded somewhat higher on Wednesday, after it hit support once again near the 126.75 (S2) support zone. However, the advance was stopped at the 127.70 (R1) level. As long as the pair is trading between the 126.75 (S2) obstacle and the downside resistance line drawn from the peak of the 8th of January, I would consider the short-term bias to be neutral for now. I prefer to see a decisive break below 126.70 (S1) before getting again confident on the downside. Something like that is possible to open the way for our next support level of 126.15 (S3), marked by the lows of the 14th and 15th of April. Switching to the daily chart, I see that on the 4th of December, the rate started tumbling after it hit resistance near the downtrend line taken from the peak of the 21st of August. Therefore, I would consider the longer-term path of EUR/JPY to be negative.
• Support: 127.00 (S1), 126.75 (S2), 126.15 (S3)
• Resistance: 127.70 (R1), 128.50 (R2), 129.00 (R3)
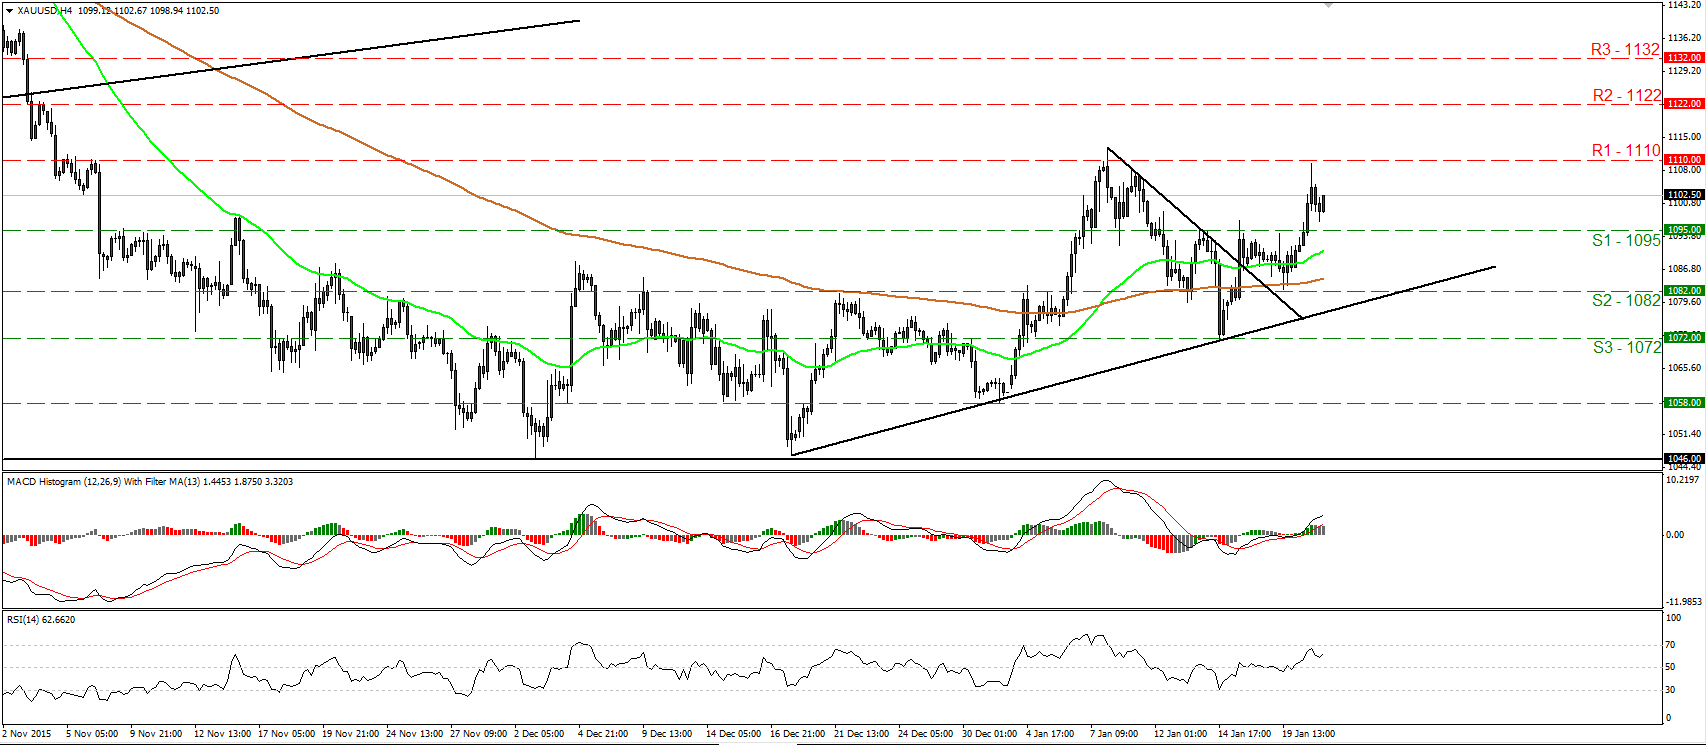
Gold edges higher
• Gold accelerated higher yesterday, breaking above the resistance (now turned into support) line of 1095 (S1). Subsequently, the metal hit resistance fractionally below the 1110 (R1) line and retreated somewhat. Bearing in mind that the price is trading above the downtrend line taken from the peak of the 8th of January and above the uptrend line drawn from the low of the 17th of December, I would consider the short-term outlook to stay positive. I would expect a clear move above 1110 (R1) to see scope for extensions towards our next obstacle of 1122 (R2). Our short-term oscillators reveal strong upside speed and corroborate my view that the metal is possible to continue trading higher, at least in the short run. The RSI turned up again and looks able to aim for another test near its 70 line, while the MACD stands above both its zero and signal lines, and points north. As for the broader trend, the metal formed a higher high on the 8th of January, near 1110 (R1). Then it printed a higher low on the 14th of the month. As a result, I still see a cautiously positive medium-term outlook.
• Support: 1082 (S1), 1072 (S2), 1058 (S3)
• Resistance: 1095 (R1), 1110 (R2), 1122 (R3)
Natural Gas futures emerge above 2.140
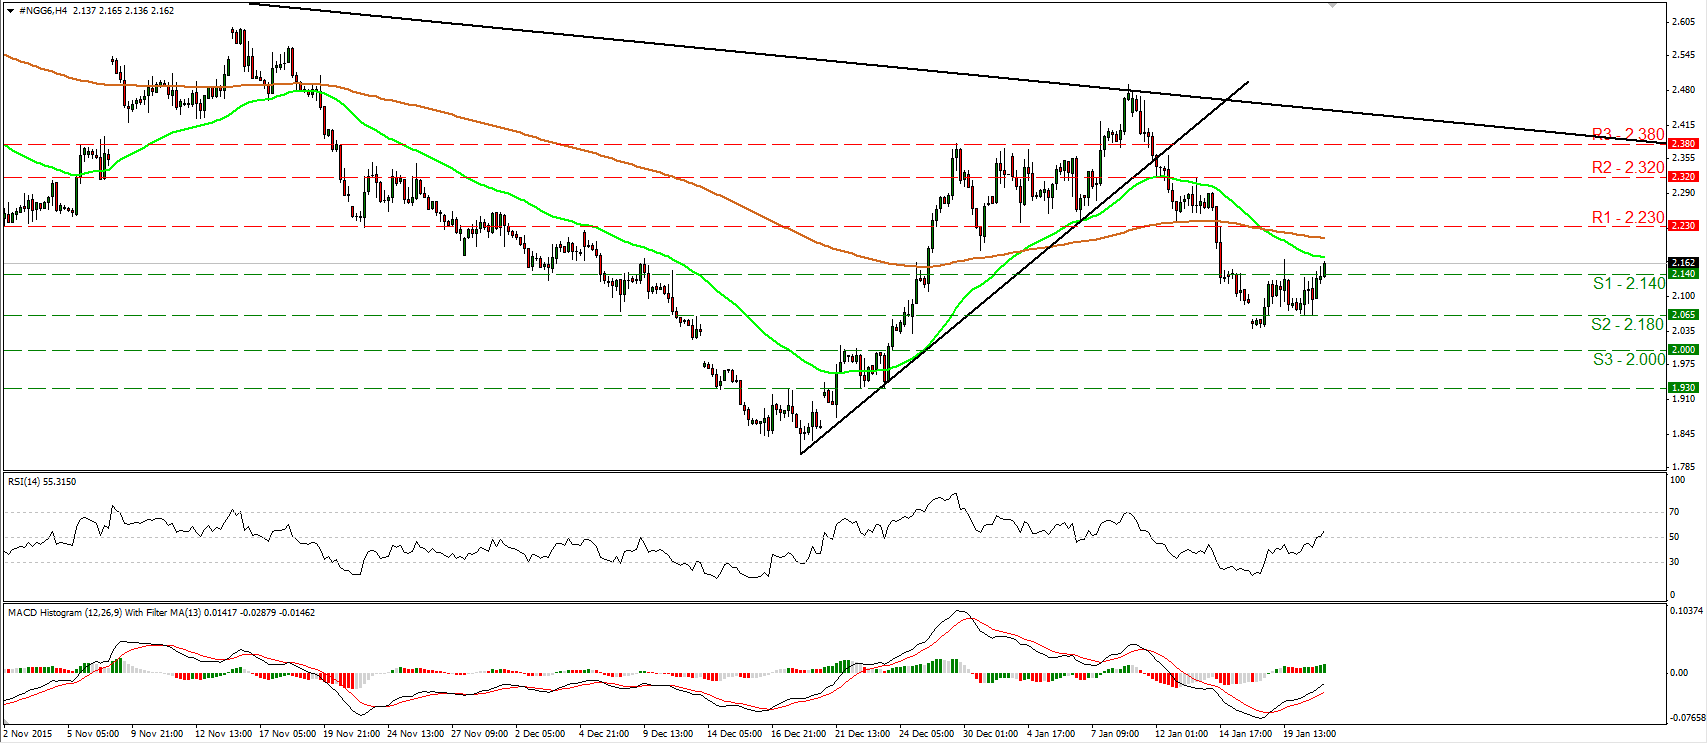
• Natural Gas traded higher yesterday, breaking above the resistance (now turned into support) barrier of 2.140 (S1). I believe that the bulls will take advantage of that break and perhaps target the 2.230 (R1) resistance zone. A decisive more above that obstacle is likely to see scope for extensions towards the next resistance of 2.320 (R2). Our short-term oscillators detect upside momentum and corroborate my view that the price is poised to trade higher, at least for a test at the 2.230 (R1) area. The RSI edged higher and managed to move above its 50 line, while the MACD, although negative, stands above its trigger line and points north. As for the bigger picture, natural gas is still trading below the downside resistance line taken from the peak of the 12th of August. As a result, I would consider the longer-term picture to be cautiously negative and I would treat any further short-term advances that stay limited below the aforementioned line as a corrective phase.
• Support: 2.140 (S1), 2.180 (S2), 2.000 (S3)
• Resistance: 2.230 (R1), 2.320 (R2), 2.380 (R3)
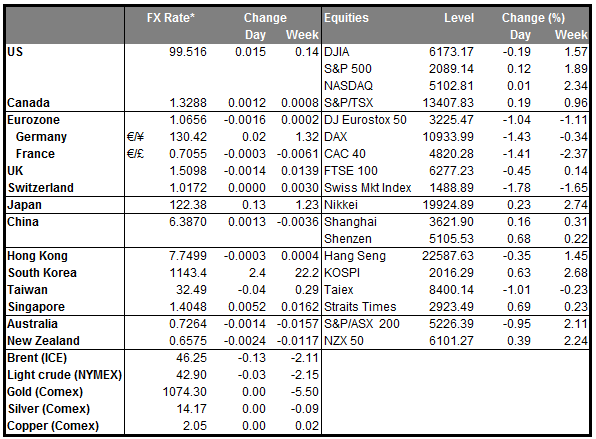
BENCHMARK CURRENCY RATES - DAILY GAINERS AND LOSERS
MARKETS SUMMARY
Which stock should you buy in your very next trade?
AI computing powers are changing the stock market. Investing.com's ProPicks AI includes 6 winning stock portfolios chosen by our advanced AI. In 2024 alone, ProPicks AI identified 2 stocks that surged over 150%, 4 additional stocks that leaped over 30%, and 3 more that climbed over 25%. Which stock will be the next to soar?
Unlock ProPicks AI
