Over the past few days, I’ve started seeing articles that state Dow Theory has generated a sell signal. I believe those authors to be wrong. As I’ve mentioned in the past, the most likely reason a Dow theorist makes mistakes is in identifying secondary highs and lows. If a practitioner misidentifies a secondary low during a rally low and price subsequently breaks below that low, it generates a “Dow Theory Sell Signal” for them. During the past six years (current bull market by my count), I’ve seen at least five calls for the top from other technicians that have been wrong…due to misidentification of secondary lows.

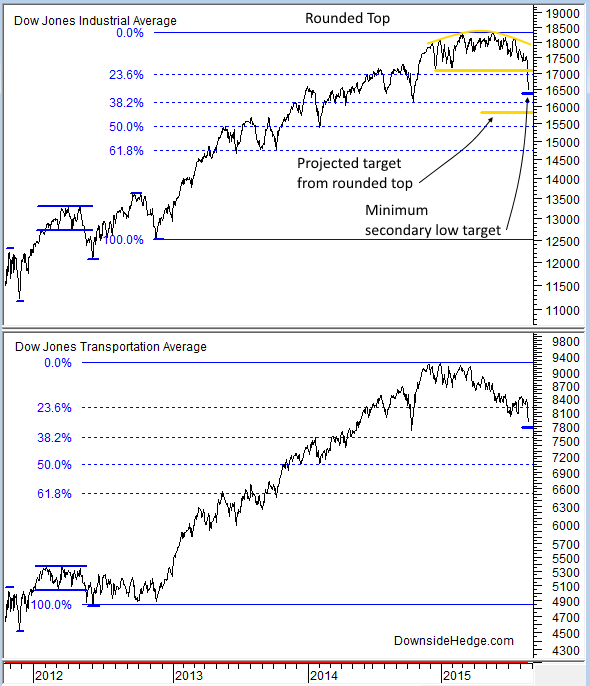
By my count, the last secondary low for the Dow Jones Industrial Average (DJIA) was in November of 2012 (and hasn’t been broken yet…so the long term trend is still up). The rally out of that low was so powerful that it lacked dips that were large in price or long in duration. The current dip now meets both of those criteria, which makes it a much better candidate for a new secondary low. Both DJIA and the transports (DJTA) have retraced nearly 33% of the rally from their 2012 lows.
We can’t be sure that a secondary low has been made until we see the nature of the next bounce, but we can project some likely targets for the low. First would be the 33% retracement of the current rally on DJIA near 16,400. The second likely place to bounce would be the 38.2% Fibonacci retracement level, which is also near the October 2014 lows at 16,100. Finally, the double top pattern that was just triggered projects a minimum decline to about 15,825. I suspect we’ll get a bounce somewhere in that range.
To make an official call on the next secondary low, I’m looking for a low that has a subsequent rally that lasts roughly three weeks. I wouldn’t be surprised to see the next rally take some time and carry back to the 50 day moving average on DJIA and DJTA. That type of bounce should give us a good secondary low that, if broken to the downside, would signal that the very long term trend is now down. But until that occurs, the long term trend is still up.

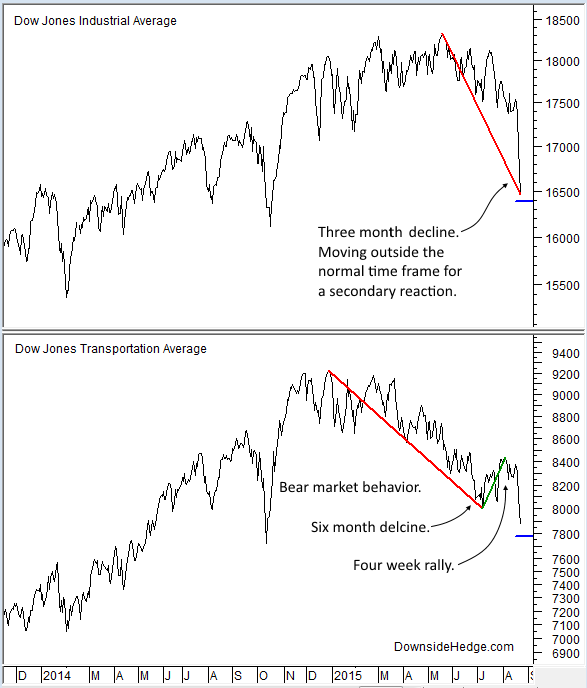
I am, however, seeing some signs that this bull market may have already topped. First is that it’s six years long, so it’s in the longer range of bull markets. Second, DJTA is exhibiting bear market behavior with long declines and short rallies. Third, the decline in DJIA is now three months long, which puts it at the outer edge of a normal bull market decline.
Conclusion
According to my read of Dow Theory, the long term trend is still up, but I’m seeing signs that the top may be in. The nature of the next rally will likely give us all the information we need to determine if we’ve entered a bear market.