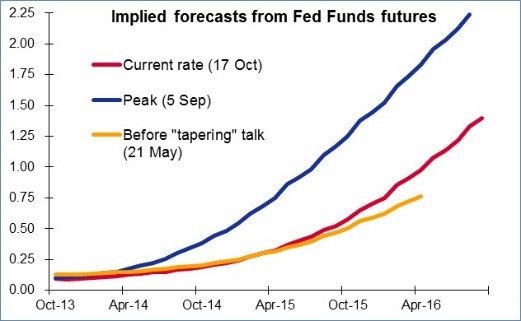
The dollar continued to lose ground overnight, with only NZD showing any significant weakness vs USD (largely on technical factors). As we mentioned yesterday, the market believes the Fed is on hold at least until December and perhaps until March, after the next debt ceiling fight. June 2016 Fed Funds futures, which peaked at 2.04% on 5 Sep, are now forecasting only 1.14% Fed Funds at that time, far far below the previous estimate. Bond yields have also been collapsing – the 10yr Treasury yield fell to 2.59% yesterday, down 10 bps on the week and 40 bps below the September highs. Lower rates helped to support US stocks, which closed at a record high yesterday despite some disappointing earnings.
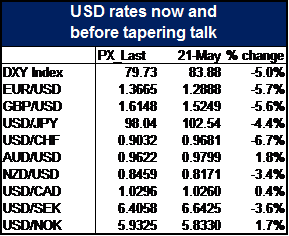
Naturally, lower yields now and expectation that rates in the future will be lower than previously expected are hurting the dollar. Actually the US currency is lower than it was before the “tapering” talk began back in May. That’s probably due to two reasons: one, even back then people assumed that QE was going to end sooner or later, and B) then, the US economy was thought to be on much sounder ground than the Eurozone and UK.
While the FT carried an article yesterday saying that the Fed could still begin tapering in December, Chicago Fed President Evans, an outspoken dove, said the Fed would likely need “a couple of meetings to assess” the economy before moving, while Dallas Fed President Fisher, a more hawkish person, said talk of tapering has “all been swamped by fiscal shenanigans.” Yesterday’s Phili Fed survey was lower than the previous month although it did exceed expectations. Given the good economic reports we’re getting out of other countries recently, we will have to see some improvement in the US statistics before we are likely to see a revival in tapering expectations and hence in the dollar.
China’s Q3 GDP and September industrial production came out in line with expectations. That boosted oil somewhat but it failed to regain all its losses. On the other hand the precious metals with industrial uses – palladium and platinum – did well, as did copper. Gold and silver were also higher on the lower USD and expectations of continued low rates.
Europe and the US have empty economic calendars today. That will shift investors’ focus to Canada’s CPI data. The Bank of Canada’s core measure of CPI for September is expected to have risen by 0.3% mom, an acceleration from 0.2% mom the previous month. This will keep the yoy rate unchanged at 1.1%. There is a noticeable number of central bank speakers to keep the calendar alive: ECB’s Nowotny speaks in Vienna and finally, Feds Lacker, Tarullo and Dudley speak in Washington, while Fed Evans speaks on economy in Chicago and Fed Stein on financial imbalances in Boston.


The Market:
EUR/USD EUR/USD Hourly Chart" title="EUR/USD Hourly Chart" width="723" height="459" src="https://d1-invdn-com.akamaized.net/content/pic12ade23a2d9772482927ab78f60e0238.png" />
The EUR/USD surged, breaking the upper boundary of the symmetrical triangle formation. During the early European morning, the pair is trading above the 1.3644 support (S1). If yesterday’s buying pressure continues, I expect the rate to challenge the 161.8% Fibonacci extension level of the triangle’s width at 1.3750 (R2). Both oscillators violated their downward sloping resistance lines and alongside with the bullish cross of the moving averages. That increases the probability of further upward movement.
• Support: 1.3644 (S1), 1.3564 (S2), 1.3461 (S3)
• Resistance: 1.3706 (R1), 1.3750 (R2), 1.3855 (R3).
EUR/JPYEUR/JPY Hourly Chart" title="EUR/JPY Hourly Chart" width="723" height="459" src="https://d1-invdn-com.akamaized.net/content/picfc8a53832c43597d660a1f0b4da1347a.png" />
• EUR/JPY moved higher, breaking above the 133.83 (R1) barrier. At the time of writing the rate is found slightly above it and I expect it to target the 134.94(R1) barrier (100% retracement of the downward movement). The 50-period moving average lies above the 200-moving average, providing support to the price action. Momentum indicators support the notion, since the RSI moves follows an upward path and the MACD, which is already in positive territory, seems ready to cross above its trigger.
• Support: 133.83 (S1), 132.75 (S2), 132.16 (S3).
• Resistance: 134.94 (R1), 135.63 (R2), 136.72 (R3).
EUR/GBPEUR/GBP Hourly Chart" title="EUR/GBP Hourly Chart" width="723" height="459" src="https://d1-invdn-com.akamaized.net/content/picd1c75bce02ddf6fcd16cd8112ce98f5c.png" />
The EUR/GBP moved lower after testing once more the 38.2% Fibonacci retracement level of the previous uptrend. The price is currently lying slightly above the lower boundary of the correction’s channel. A dip below it followed by a break of the 0.8443 support would signal the completion of the correction. On the other hand, if the rate fails to break that support, we might see it targeting the 0.8552 (R2) barrier, which coincides with the 50% Fibonacci retracement level of the downtrend. Both oscillators continue moving to the downside, making it more likely that we will see the former scenario come to pass.
• Support: 0.8443 (S1), 0.8387 (S2), 0.8332 (S3).
• Resistance: 0.8509 (R1), 0.8552 (R2) and 0.8631 (R3).
GoldXAU/USD Hourly Chart" title="XAU/USD Hourly Chart" width="723" height="459" src="https://d1-invdn-com.akamaized.net/content/pic5bbe6729500d1f716aefc2f7c18e2a8d.png" />
Gold moved higher as we expected, but what we didn’t expect was the trend line’s break. At the time of writing the yellow metal is finding resistance at the 200-period moving average, which coincides with the 38.2% retracement level of the metal’s downtrend at 1322 (R1). The bulls’ failure to penetrate that hurdle might turn the bias to the downside again. The RSI found resistance at its 70 barrier and moved lower, confirming the validity of the aforementioned hurdle.
• Support: 1305 (S1), 1287 (S2), 1262 (S3).
• Resistance: 1322 (R1), 1343 (R2), 1364 (R3).
Oil
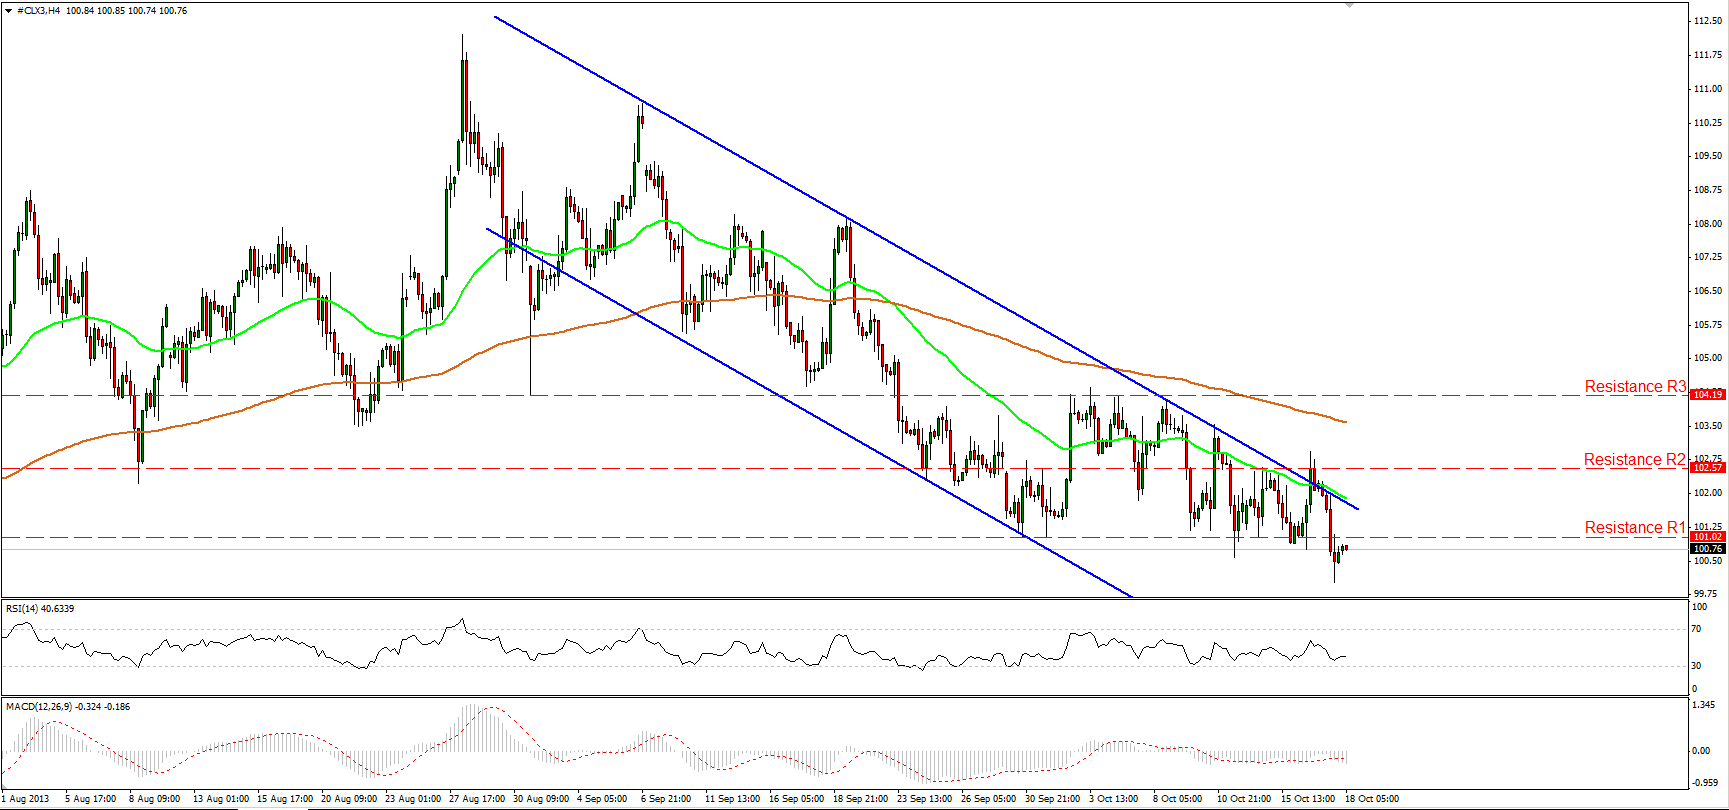
WTI moved significantly lower, breaking the key floor of 101.02. At the time we thought the bears had lost the battle, they found the strength to achieve that significant break. Technically, such a break should have significant bearish implications, targeting the next support at 99.26 (S1). The price returned back into the blue downtrend channel, while the 50-period moving average remains below the 200-period moving average, confirming the negative picture of WTI.
• Support: 99.26 (S1), 97.36(S2), 96.04(S3).
• Resistance: 101.02 (R1), 102.57(R2), 104.19 (R3).
BENCHMARK CURRENCY RATES - DAILY GAINERS AND LOSERS
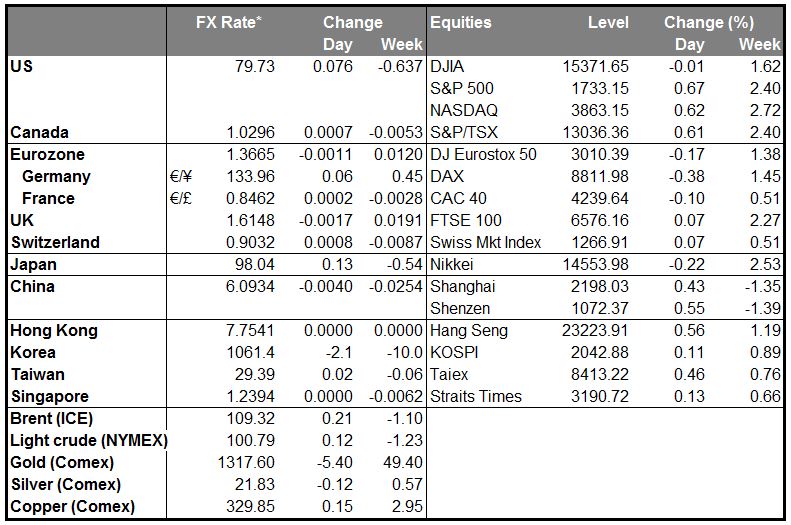
MARKETS SUMMARY:
Which stock should you buy in your very next trade?
With valuations skyrocketing in 2024, many investors are uneasy putting more money into stocks. Unsure where to invest next? Get access to our proven portfolios and discover high-potential opportunities.
In 2024 alone, ProPicks AI identified 2 stocks that surged over 150%, 4 additional stocks that leaped over 30%, and 3 more that climbed over 25%. That's an impressive track record.
With portfolios tailored for Dow stocks, S&P stocks, Tech stocks, and Mid Cap stocks, you can explore various wealth-building strategies.


