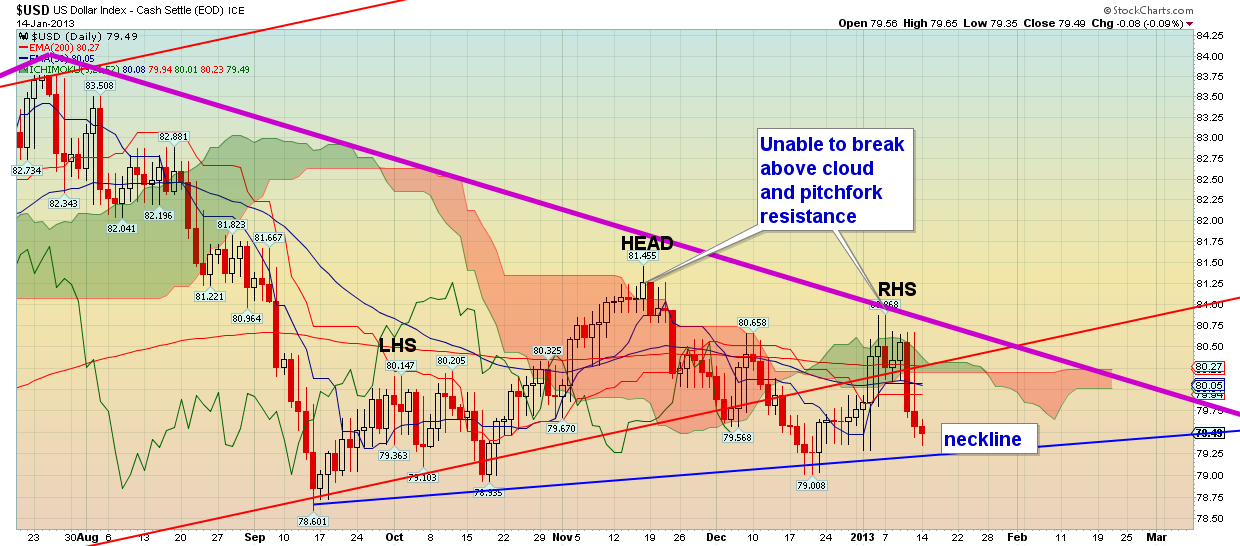
The dollar index is heavily influenced by price movements in the euro. Our bullish view on EUR/USD, as shown in previous posts, is connected to our bearish view of the potential of the dollar index. There is a pattern forming in this index that, if exploited, could provide us with a good, low risk profit.
As shown in the chart, the dollar index has likely completed a head and shoulders formation:

It is important to see now if the dollar index will break the head and shoulders neckline, in order to activate our trade idea. When prices break the necklines of head and shoulders patterns, they extend lower - as much as the height of the head. Another sign of weakness in the dollar index is the inability of buyers to push prices above the purple pitchfork resistance and above the ichimoku cloud resistance.
In conclusion, this pattern may need some time to develop as we expect it. Now that we identified it, there is only one thing to do: sell, if prices break the neckline of this pattern.
Disclosure: None of the information or opinions expressed in this blog constitutes a solicitation for the purchase or sale of any security or other instrument. Nothing in this article constitutes investment advice and any recommendations that may be contained herein have not been based upon a consideration of the investment objectives, financial situation or particular needs of any specific recipient. Any purchase or sale activity in any securities or other instrument should be based upon your own analysis and conclusions.
As shown in the chart, the dollar index has likely completed a head and shoulders formation:

It is important to see now if the dollar index will break the head and shoulders neckline, in order to activate our trade idea. When prices break the necklines of head and shoulders patterns, they extend lower - as much as the height of the head. Another sign of weakness in the dollar index is the inability of buyers to push prices above the purple pitchfork resistance and above the ichimoku cloud resistance.
In conclusion, this pattern may need some time to develop as we expect it. Now that we identified it, there is only one thing to do: sell, if prices break the neckline of this pattern.
Disclosure: None of the information or opinions expressed in this blog constitutes a solicitation for the purchase or sale of any security or other instrument. Nothing in this article constitutes investment advice and any recommendations that may be contained herein have not been based upon a consideration of the investment objectives, financial situation or particular needs of any specific recipient. Any purchase or sale activity in any securities or other instrument should be based upon your own analysis and conclusions.
3rd party Ad. Not an offer or recommendation by Investing.com. See disclosure here or remove ads.
Which stock should you buy in your very next trade?
With valuations skyrocketing in 2024, many investors are uneasy putting more money into stocks. Unsure where to invest next? Get access to our proven portfolios and discover high-potential opportunities.
In 2024 alone, ProPicks AI identified 2 stocks that surged over 150%, 4 additional stocks that leaped over 30%, and 3 more that climbed over 25%. That's an impressive track record.
With portfolios tailored for Dow stocks, S&P stocks, Tech stocks, and Mid Cap stocks, you can explore various wealth-building strategies.
