Has Trump’s "Chip for Rare Earth" strategy backfired?
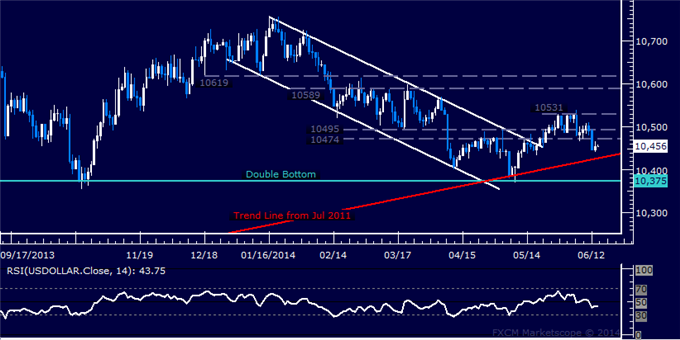
US Dollar in Wait-and-See Mode at Key Trend Threshold
Prices paused for a breather after last week’s aggressive downturn. A move below resistance-turned-support in the 10474-95 area has exposed pivotal rising trend line support set from July 2011 (now at 10429). A breach beneath this barrier on a daily closing basis clears the way for a challenge of a double bottom at 10375. Alternatively, a reversal back above 10495 opens the door for another test of 10531, the May 28 high.

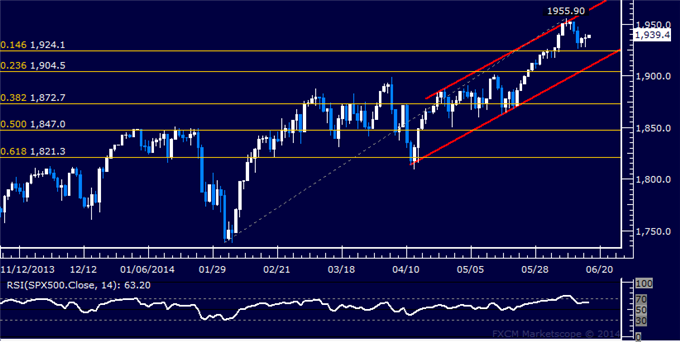
S&P 500 Attempting Cautious Bounce from Chart Support
Prices turned lower as expected after putting in a Hanging Man candlestick.Near-term support is at 1924.10, the 14.6% Fibonacci retracement, with a break below that on a daily closing basis exposing the 23.6% level at 1904.50. This barrier is reinforced by the bottom of a rising channel guiding the index’s uptrend since mid-April (1908.40). Resistance is at 1955.90, the June 9 high, followed by the channel top at 1964.60.

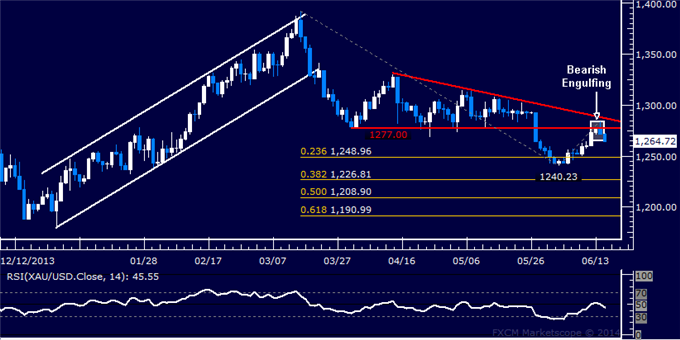
Gold Recoils from Resistance
Prices are moving lower after putting in a Bearish Engulfing candlestick pattern below support-turned-resistance at 1277.00, the underside of a recently broken Triangle formation. Near-term support is at 1248.96, the 23.6% Fibonacci expansion, with a break below that on a daily closing basis exposing the June 3 low at 1240.23 and the 38.2% level at 1226.81. Alternatively, a move above 1277.00 eyes yesterday’s swing high at 1284.77.

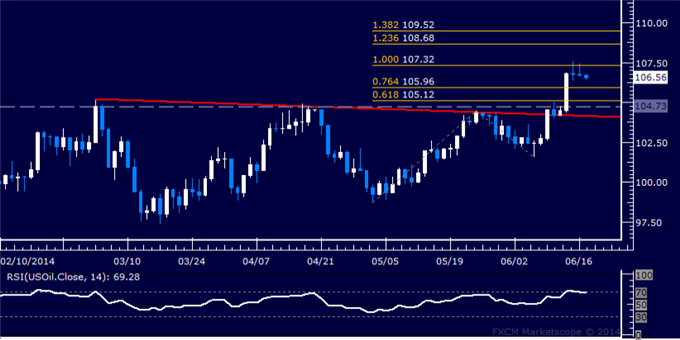
Crude Oil Vulnerable Anew
Prices are stalling below resistance at 107.32, the 100% Fibonacci expansion, after jumping to the strongest level since mid-September 2013 late last week. Back-to-back indecision candles warn of ebbing bullish momentum and hint a reversal may be ahead. Support comes in at 105.96, the 76.4% Fib. A reversal below that initially aims for the 61.8% expansion at 105.12. Alternatively, a move above resistance targets the 123.6% level at 108.68.

Which stocks should you consider in your very next trade?
The best opportunities often hide in plain sight—buried among thousands of stocks you'd never have time to research individually.
That's why smart investors use our Stock Screener with 50+ predefined screens and 160+ customizable filters to surface hidden gems instantly.
For example, the Piotroski's Picks method averages 23% annual returns by focusing on financial strength, and you can get it as a standalone screen. Momentum Masters catches stocks gaining serious traction, while Blue-Chip Bargains finds undervalued giants.
With screens for dividends, growth, value, and more, you'll discover opportunities others miss. Our current favorite screen is Under $10/share, which is great for discovering stocks trading under $10 with recent price momentum showing some very impressive returns!
