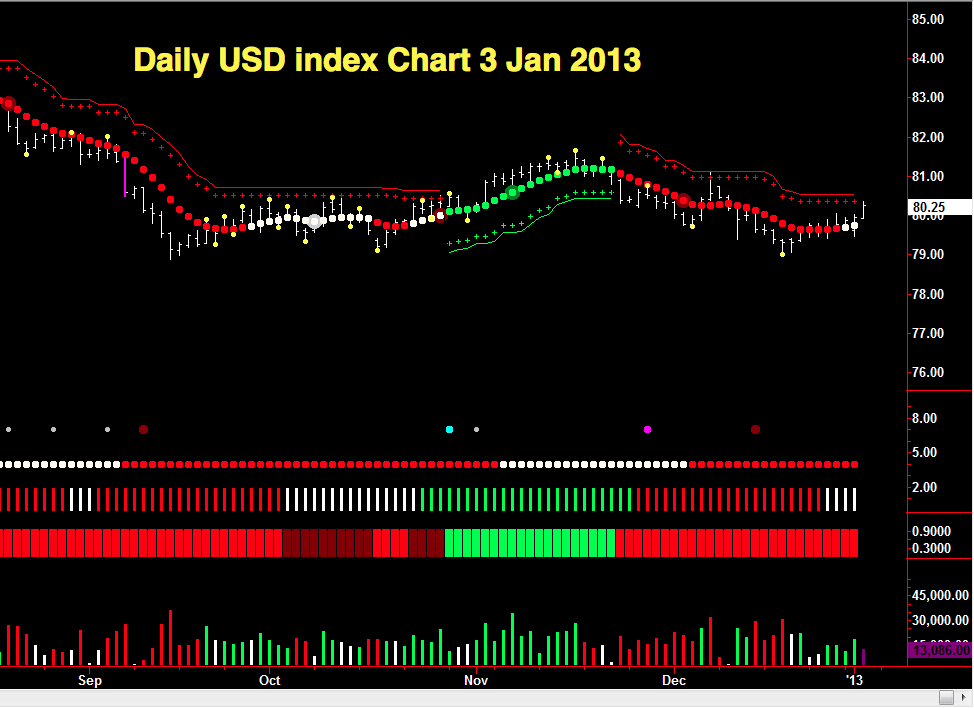
The dollar index continues to trade in a relatively narrow range which has been in place since early September 2012. The floor of this range is now well defined in the 79.00 price area with a series of isolated pivot lows posted throughout September and October with the last of these generated on 19th December as the index tested the 79.01 level once again.

To the upside the usd index has struggled to breach the 81.50 price region, again defined by a series of isolated pivot highs over the same time period.
The isolated pivot low of mid December has resulted in a consequent bounce higher with the index now breaking above the 80.00 price point once again and currently trading at 80.28. This rise in the index has seen most of the major currency pairs pushing lower as a result.
The daily trend for the index is now in transition, moving from bearish red to white but this has yet to be reflected on the 3 day trend which remains firmly bearish, for the time being.
Buyers have returned in limited numbers on the daily chart since the end of 2012 but remain cautious, reflective of a lack of market direction and hesitation. The three day volumes confirm this picture, remaining neutral and showing no clear bias.
From a technical perspective the congestion area outlined above is now the key to any longer term trend, either to the upside or the downside but in the short term expect to see further sideways price congestion in this range. For any trend to develop we will need to see a combination of a breakout coupled with rising and sustained volumes across both timeframes.
3rd party Ad. Not an offer or recommendation by Investing.com. See disclosure here or remove ads.
Which stock should you buy in your very next trade?
With valuations skyrocketing in 2024, many investors are uneasy putting more money into stocks. Unsure where to invest next? Get access to our proven portfolios and discover high-potential opportunities.
In 2024 alone, ProPicks AI identified 2 stocks that surged over 150%, 4 additional stocks that leaped over 30%, and 3 more that climbed over 25%. That's an impressive track record.
With portfolios tailored for Dow stocks, S&P stocks, Tech stocks, and Mid Cap stocks, you can explore various wealth-building strategies.
