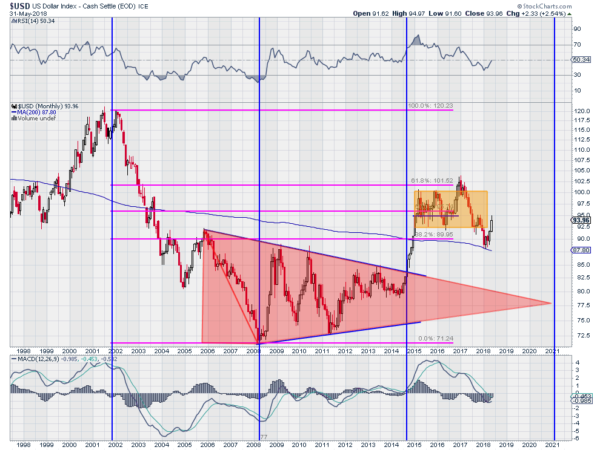
The latest 6 year cycle for the US Dollar started well before the Trump administration started to play trade hardball. With a break out of a symmetrical triangle in 2014 it rose fast. It topped after two years of moving sideways in a channel at the target move objective over 102.50 and a 61.8% retest of the move lower following the decline from 2002 to 2008, and then reversed. It is the reversal that began after the election.
That move lower continued for a year until finding support at the start of 2018. With 3 months of consolidation, it started to move higher in April. And May has shown strong follow through. The monthly chart below details the consolidation over the 200 month SMA on a retest and then the pop higher. Now it is back in the consolidation zone. What is next?
The chart suggests there is more upside. Broadly, there are still 2 1/2 years left in this cycle higher. But the momentum is turning up as well. The RSI has made a higher high at the mid line and is rising. The MACD has reset and is now curled up for a cross up, a bullish signal. The next confirmation would be a monthly close over the October and November 2017 highs just above 95 to confirm continuation.
The information in this blog post represents my own opinions and does not contain a recommendation for any particular security or investment. I or my affiliates may hold positions or other interests in securities mentioned in the Blog, please see my Disclaimer page for my full disclaimer.
Which stock should you buy in your very next trade?
AI computing powers are changing the stock market. Investing.com's ProPicks AI includes 6 winning stock portfolios chosen by our advanced AI. In 2024 alone, ProPicks AI identified 2 stocks that surged over 150%, 4 additional stocks that leaped over 30%, and 3 more that climbed over 25%. Which stock will be the next to soar?
Unlock ProPicks AI
