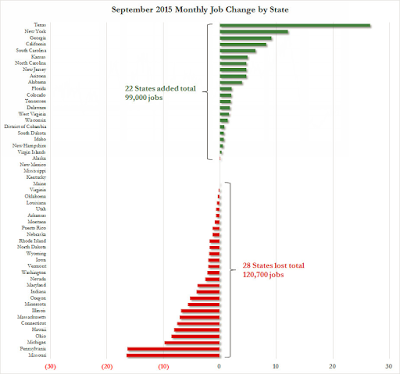
In a curious event, ZeroHedge reports The September Jobs Report Was Even Worse: U.S. States Lost A Total of 22,000 Jobs.
Zero Hedge noted that the month-over-month total of nonfarm payrolls was -22,000 while the nonfarm total was well over 100,000 nationally.
He posted this chart.

Those numbers match my totals. And as ZeroHedge reports, 28 states lost jobs while 22 gained.
But it's not that simple. From the same data, here is a table of nonfarm payrolls for the last three months.
Nonfarm Payrolls (In Thousands)
| Jul States Sum | Aug States Sum | Sep States Sum | Jul National | Aug National | Sep National | Jul-Aug Nat | Aug-Sep Nat | Jul-Aug States | Aug-Sep States |
|---|---|---|---|---|---|---|---|---|---|
| 143,071 | 143,218 | 143,197 | 142,093 | 142,229 | 142,341 | 136 | 112 | 147 | -22 |
Yes, month over month, states lost 22,000 jobs. But also notice that state totals overall beat national totals by 856,000 jobs.
Which stat do you believe?
I have been aware of this discrepancy for a long time, and have been working on this data with the Michael Lucci and Connor White at Illinois Policy Institute since July.
Here is an email we received from Tyler Downing at the BLS on July 22.
Hello Connor,Thank you for contacting the Current Employment Statistics (CES) program.
CES independently develops national and state and area employment, hours, and earnings series. Both sets of estimates are based on the same establishment reports; however, CES uses the full establishment survey sample to produce monthly national employment estimates, while CES uses only the state-specific portion of the sample to develop state employment estimates.
State and area estimates use smaller amounts of sample by industry than the national industry estimates. This increases the error component associated with state and metropolitan level estimates. For this reason, aggregating state data to the national level will also sum this error component, resulting in different estimates of U.S. employment, hours, and earnings. Summed state level CES estimates should not be compared to national CES estimates.
Estimates for states and areas are produced using two methods. The majority of state and area estimates are produced using direct sample-based estimation. However, published area and industry combinations (domains) that do not have a large enough sample to support estimation using only sample responses have been estimated using modeling techniques.
Random Results
As noted above, the current state summation actually exceeds the national total, even though the latest month-over-month state total summation is negative.
When I first went through this exercise many months ago, I thought there was a serious issue but concluded there wasn't.
To verify, Michael Lucci and I went through the process of downloading year's worth of history but the results appeared random.
Double Counting Part-Time Jobs?
This is not a validation of the overall BLS process by any means.
I remain firmly convinced the BLS is double counting part-time jobs. And in a recent phone conversation, a BLS analyst admitted it was possible.
I asked a simple question: Why don't you sort out duplicate social security numbers?
The answer I received was "we would like to but we do not have access to the data for privacy reasons."
A decent sort-merge algorithm could hash this out easily, but only if the BLS had access to SS numbers.
So here we are wondering why the sum of the parts exceeds the whole overall, while we frequently see the opposite effect month over month.
The much-maligned BLS appears to blame, but in actuality, it appears as if the BLS does not have access to the data they need to produce valid numbers.
Are major discrepancies like these better than no numbers at all?
Which stock should you buy in your very next trade?
AI computing powers are changing the stock market. Investing.com's ProPicks AI includes 6 winning stock portfolios chosen by our advanced AI. In 2024 alone, ProPicks AI identified 2 stocks that surged over 150%, 4 additional stocks that leaped over 30%, and 3 more that climbed over 25%. Which stock will be the next to soar?
Unlock ProPicks AI