Yesterday, the Institute for Supply Management released its much followed Manufacturing ISM® Report On Business®. 
What's It Mean?
The PMI is a diffusion index. Numbers above 50 indicate expansion, numbers below 50 indicate contraction.
A key problem with diffusion indices is the size of the company does not matter. For example, a chemical company with 300 employees carries the same weight as an auto manufacturer with 200,000 employees.
Moreover, there are some peculiarities with the break-even number of 50.
The ISM says:
A PMI® in excess of 43.1 percent, over a period of time, generally indicates an expansion of the overall economy. Therefore, the January PMI® indicates growth for the 68th consecutive month in the overall economy, and indicates expansion in the manufacturing sector for the 20th consecutive month. Holcomb stated, "The past relationship between the PMI® and the overall economy indicates that the PMI® for January (53.5 percent) corresponds to a 3.3 percent increase in real gross domestic product (GDP) on an annualized basis.
Thus, a manufacturing PMI above or below 50, does not imply similar overall economic activity as one might expect. Also, month-to-month changes show a lot a variances so it's important to look at trends over a longer period of time.
Manufacturing ISM Historical
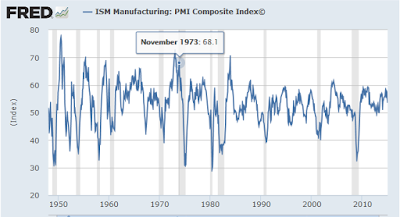
The NBER (the historical arbiter of when recessions start and end) says a US recession began in November of 1973. The Manufacturing ISM was 68.1 at the time.
The above chart also shows some recessions began with the manufacturing PMI in negative territory. In isolation, the PMI itself does not say a lot. One needs to incorporate other data.
Manufacturing ISM Percent Change From Year Ago
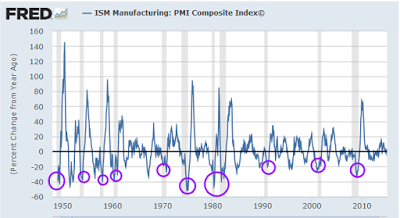
Upturns from deeply negative numbers tend to end recessions (purple circles), but spikes below the zero-growth tend line don't necessarily mean anything.
There were 10 occasions since 1950 in which the year-over-year growth of manufacturing PMI sunk to -20% that were not associated with a recession.
On the other hand, the chart shows that recessions generally start with the PMI near the zero-growth line. In those occasions where recessions started with PMIs well above 50, the PMI quickly crashed into negative territory.
Manufacturing ISM Percent Change From Year Ago Detail
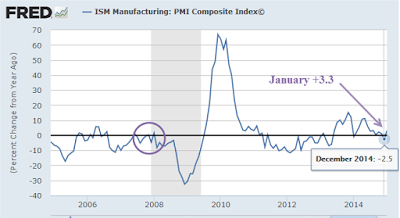
Far too much credence is given to these indicators, even though flirting around the zero-line is generally not associated with high growth.
The Manufacturing ISM is now at a spot where recessions frequently begin. Yet, far more often than not, recessions do not begin at this spot.
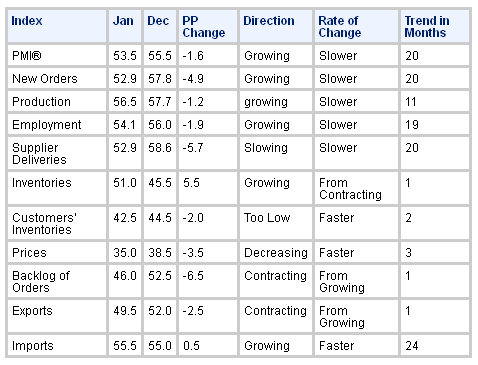
Nonetheless, please note the weakening trends in the table at the top.
- Exports are slowing
- Imports are up
- Prices falling rapidly
- Backlog of orders in contraction
- Growth slowing nearly everywhere
- Customer inventories rising
None of those imply strong growth.
The ISM says yesterday's report: "corresponds to a 3.3 percent increase in real gross domestic product (GDP) on an annualized basis". I will take the under advisement for numerous reasons stated previously.
For more GDP look-ahead analysis, please see ...
- January 31: Diving Into the GDP Report - Some Ominous Trends - Yellen Yap - Decoupling or Not?
- February 02: Total Construction Spending Weaker Than Expected; Residential Construction Spending in Contraction
- February 02: Four Trade War Questions; PMI Reports; Currency Manipulation Charges
Which stock should you buy in your very next trade?
With valuations skyrocketing in 2024, many investors are uneasy putting more money into stocks. Unsure where to invest next? Get access to our proven portfolios and discover high-potential opportunities.
In 2024 alone, ProPicks AI identified 2 stocks that surged over 150%, 4 additional stocks that leaped over 30%, and 3 more that climbed over 25%. That's an impressive track record.
With portfolios tailored for Dow stocks, S&P stocks, Tech stocks, and Mid Cap stocks, you can explore various wealth-building strategies.
