
T2108 Status: 53.6
VIX Status: 13.9
General (Short-term) Trading Call: Stay short. If not already short, try to fade a bounce.
Active T2108 periods: Day #93 over 20% (overperiod), Day #1 under 60% (underperiod), Day #6 under 70%
Commentary
In the last T2108 Update, I described a strange and unexpected divergence between a sinking T2108 and a resilient S&P 500 (SPY). I refrained from calling it a bearish divergence because I have been fooled in the past. This time, it was a bearish divergence of major proportions.
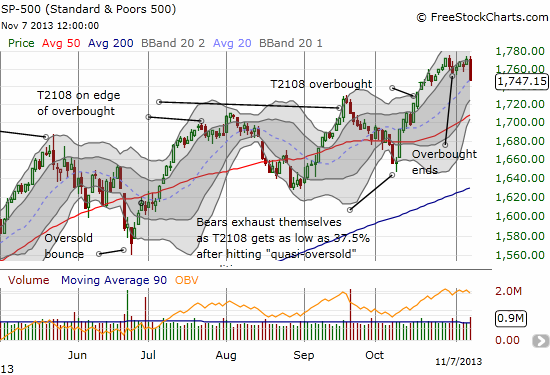
The S&P 500 dropped 1.2% on the day. This move in itself is not huge. However, I discussed earlier that the S&P 500 recently has typically experienced significant pullbacks once T2108 falls from overbought status. In THAT sense, today’s long overdue drop is huge as it could confirm that a significant pullback is finally underway. The chart below shows how dramatic today’s action looks compared to the numerous days where the S&P 500 has barely budged over the last two weeks or so.
The potential lesson here for me is that a bearish divergence is likely defined relative to T2108′s position in the cycle. I will have to check out the historical data on this theory, but I strongly suspect that bearish divergences are more important when the historical data suggest that the S&P 500 should be in decline, like now.
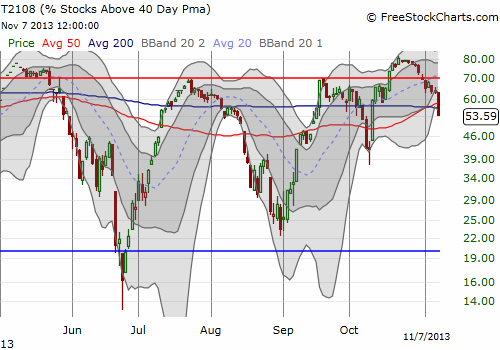
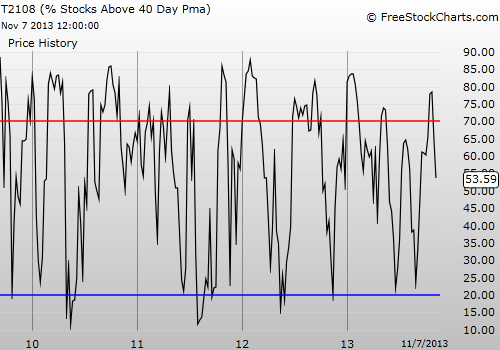
T2108 took a deep plunge. The chart below shows how the drip-drip-drip over the past week or so led to today’s big swoosh.
If this move caught you before you could get short, I recommend trying to target a fade to initiate a short. If the S&P 500 experiences follow-through selling on Friday (Nov 8th), then I will be watching out for a quasi-oversold bounce. I will be ready with the TTM (T2108 Trading Model) in that case to assess the odds of a 1-day bounce.
Overall, the S&P 500′s drop makes shorting the market much easier. Bears can stay biased short with a stop at a new all-time high for the S&P 500; Thursday’s plunge from the sky puts the burden of proof on the buyers. My strong suspicion is that a new all-time high will NOT be happening for quite some time; oversold conditions should come before the next overbought conditions. As always, time will tell.
I will end by wrapping up the pre/post-earnings discussion for Solar City (SCTY). With hindsight, I see that I should have stayed focused on shorting opportunities given my overall bearish bias on the market. Fortunately, most of my other trades have been firmly bearish, but I could not resist what I saw as bullish signals all over the SCTY trade. In fact, if not for today’s market sell-off, I think SCTY could have experienced a sustained bounce. Instead, SCTY’s two attempts at a bounce were met by eager sellers.
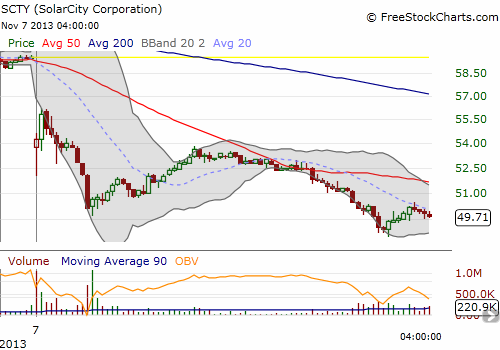
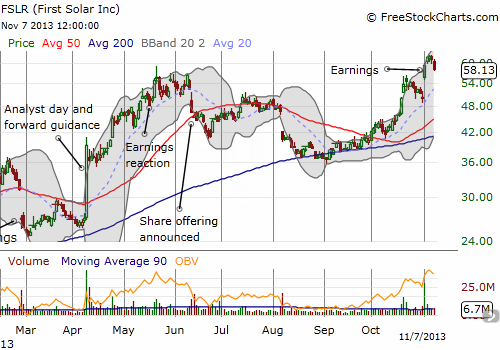
As planned, I sold short a December put into the selling (and lucked out that I was patient in doing so). Obviously, it would have been better to BUY a put at the open but at that time I thought I was going to miss an opportunity to sell a put at a good premium. It was hard watching the position go from green to red as the day came to a close, but I am sticking with it for a while. I happen to have a short in First Solar (FSLR) that looks like a good enough hedge here. (I am looooong overdue for a post on the solar plays!).

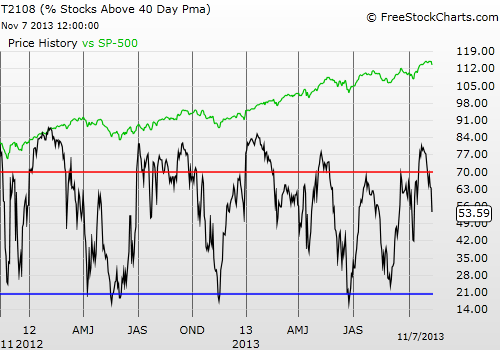
Black line: T2108 (measured on the right); Green line: S&P 500 (for comparative purposes)
Red line: T2108 Overbought (70%); Blue line: T2108 Oversold (20%)
Be careful out there!
Full disclosure: long SSO puts, short SCTY put, short FSLR shares
VIX Status: 13.9
General (Short-term) Trading Call: Stay short. If not already short, try to fade a bounce.
Active T2108 periods: Day #93 over 20% (overperiod), Day #1 under 60% (underperiod), Day #6 under 70%
Commentary
In the last T2108 Update, I described a strange and unexpected divergence between a sinking T2108 and a resilient S&P 500 (SPY). I refrained from calling it a bearish divergence because I have been fooled in the past. This time, it was a bearish divergence of major proportions.
The S&P 500 dropped 1.2% on the day. This move in itself is not huge. However, I discussed earlier that the S&P 500 recently has typically experienced significant pullbacks once T2108 falls from overbought status. In THAT sense, today’s long overdue drop is huge as it could confirm that a significant pullback is finally underway. The chart below shows how dramatic today’s action looks compared to the numerous days where the S&P 500 has barely budged over the last two weeks or so.
The potential lesson here for me is that a bearish divergence is likely defined relative to T2108′s position in the cycle. I will have to check out the historical data on this theory, but I strongly suspect that bearish divergences are more important when the historical data suggest that the S&P 500 should be in decline, like now.
3rd party Ad. Not an offer or recommendation by Investing.com. See disclosure here or remove ads.
T2108 took a deep plunge. The chart below shows how the drip-drip-drip over the past week or so led to today’s big swoosh.
If this move caught you before you could get short, I recommend trying to target a fade to initiate a short. If the S&P 500 experiences follow-through selling on Friday (Nov 8th), then I will be watching out for a quasi-oversold bounce. I will be ready with the TTM (T2108 Trading Model) in that case to assess the odds of a 1-day bounce.
Overall, the S&P 500′s drop makes shorting the market much easier. Bears can stay biased short with a stop at a new all-time high for the S&P 500; Thursday’s plunge from the sky puts the burden of proof on the buyers. My strong suspicion is that a new all-time high will NOT be happening for quite some time; oversold conditions should come before the next overbought conditions. As always, time will tell.
I will end by wrapping up the pre/post-earnings discussion for Solar City (SCTY). With hindsight, I see that I should have stayed focused on shorting opportunities given my overall bearish bias on the market. Fortunately, most of my other trades have been firmly bearish, but I could not resist what I saw as bullish signals all over the SCTY trade. In fact, if not for today’s market sell-off, I think SCTY could have experienced a sustained bounce. Instead, SCTY’s two attempts at a bounce were met by eager sellers.
3rd party Ad. Not an offer or recommendation by Investing.com. See disclosure here or remove ads.
As planned, I sold short a December put into the selling (and lucked out that I was patient in doing so). Obviously, it would have been better to BUY a put at the open but at that time I thought I was going to miss an opportunity to sell a put at a good premium. It was hard watching the position go from green to red as the day came to a close, but I am sticking with it for a while. I happen to have a short in First Solar (FSLR) that looks like a good enough hedge here. (I am looooong overdue for a post on the solar plays!).
Black line: T2108 (measured on the right); Green line: S&P 500 (for comparative purposes)
Red line: T2108 Overbought (70%); Blue line: T2108 Oversold (20%)
Be careful out there!
Full disclosure: long SSO puts, short SCTY put, short FSLR shares
Which stock should you buy in your very next trade?
With valuations skyrocketing in 2024, many investors are uneasy putting more money into stocks. Unsure where to invest next? Get access to our proven portfolios and discover high-potential opportunities.
In 2024 alone, ProPicks AI identified 2 stocks that surged over 150%, 4 additional stocks that leaped over 30%, and 3 more that climbed over 25%. That's an impressive track record.
With portfolios tailored for Dow stocks, S&P stocks, Tech stocks, and Mid Cap stocks, you can explore various wealth-building strategies.