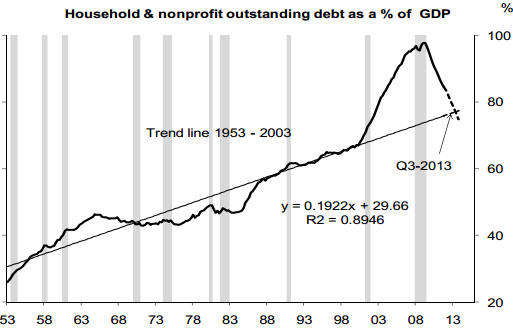
Deutsche Bank's latest research on US consumer leverage suggests that the deleveraging process may have another couple of years to run. They determined the long-term trendline based on consumer debt-to-GDP ratio from 1953 to 2003, thus excluding the bubble years. Then they compared the current leverage to this line and looked at the rate of convergence. The intersection with the trendline is expected to take place in a year.
To be on the conservative side, they also assumed another year for the leverage ratio to overshoot to the downside and/or the nominal GDP to grow at slower rate than 4%. Note that the 4.0% nominal US GDP growth projection is not unrealistic (that's roughly where it has been recently). They verified this result by repeating the exercise using a debt-to-disposable income measure rather than debt-to-GDP.
DB: ... extrapolating the current trend further, household debt-to-GDP would intersect its long-term trendline by Q3 2013. It may be that households overcompensate, or nominal growth is less than 4.0% so we are conservatively estimating two years for the end of the deleveraging process. The story is broadly similar when comparing household debt to gross disposable income. This ratio has declined from a peak of 123% in Q1 2009 to 107% as of Q1 2012—the lowest level since Q3 2003 (106%). This tells us that consumers are nearing the end of the deleveraging process.

3rd party Ad. Not an offer or recommendation by Investing.com. See disclosure here or remove ads.
Which stock should you buy in your very next trade?
With valuations skyrocketing in 2024, many investors are uneasy putting more money into stocks. Unsure where to invest next? Get access to our proven portfolios and discover high-potential opportunities.
In 2024 alone, ProPicks AI identified 2 stocks that surged over 150%, 4 additional stocks that leaped over 30%, and 3 more that climbed over 25%. That's an impressive track record.
With portfolios tailored for Dow stocks, S&P stocks, Tech stocks, and Mid Cap stocks, you can explore various wealth-building strategies.
