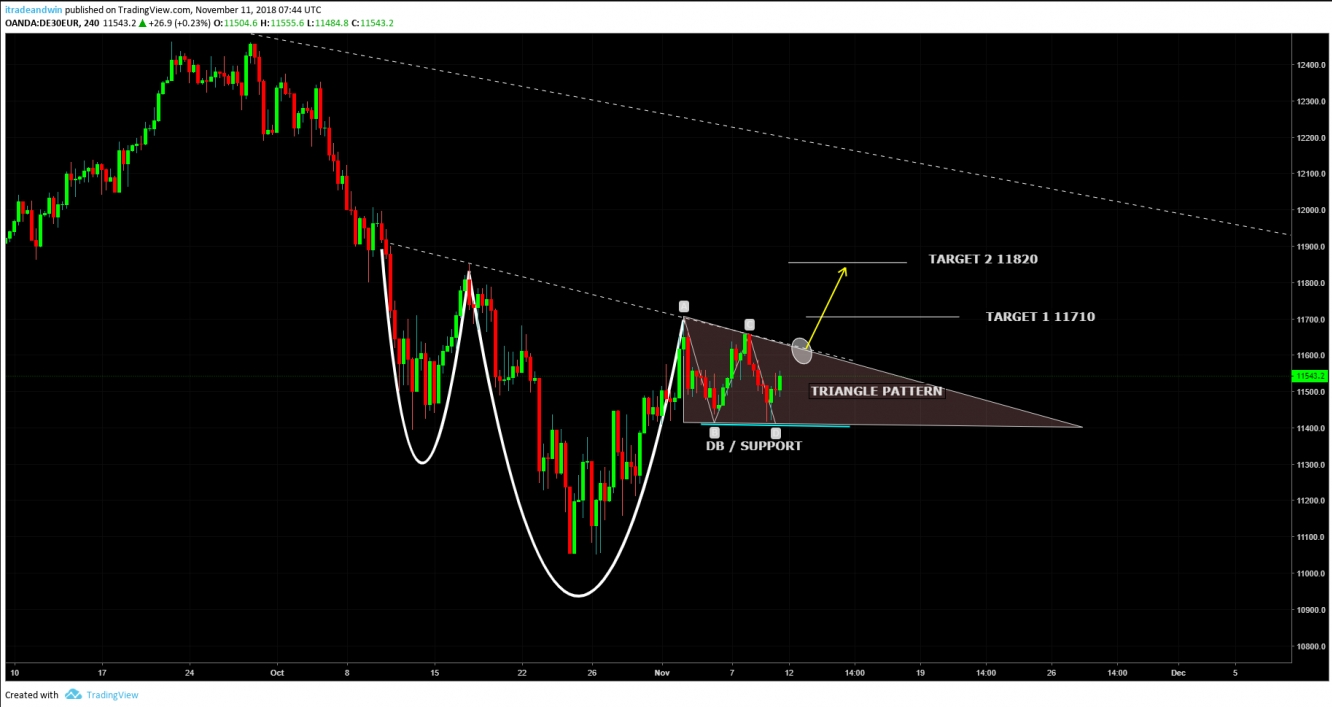
DAX Index Descending Triangle Pattern
Time Frame: H4
Pattern: Triangle
Facts :
* Finds support and makes a double bottom at 11400
* Price closed above EMA 50
Trade Opportunity: Buy the potential breakout of the triangle as shown in the chart.
Estimated breakout level: 11563 – Confirmed by MM 2/8
Targets: 11710 and 11820
Invalidation Level: Below the double bottom 11400
Aggressive Traders: May long at the current level with the same stop loss
This chart has been published for educational purposes only and cannot be considered as a trading advice.
This analysis prepared by the global analysts of Chartreaderpro.com and published on Investing.com. Commercial distribution is strictly prohibited.
Which stock should you buy in your very next trade?
With valuations skyrocketing in 2024, many investors are uneasy putting more money into stocks. Unsure where to invest next? Get access to our proven portfolios and discover high-potential opportunities.
In 2024 alone, ProPicks AI identified 2 stocks that surged over 150%, 4 additional stocks that leaped over 30%, and 3 more that climbed over 25%. That's an impressive track record.
With portfolios tailored for Dow stocks, S&P stocks, Tech stocks, and Mid Cap stocks, you can explore various wealth-building strategies.

