Trump announces 50% tariff on copper, effective August 1

Due to the impact of Hurricane Sandy on the East Coast several major economic reports were moved from October 30 to the already very crowded economic release day of November 1. Therefore, I am going to touch on the major reports from behind the headlines analyzing the trend of data for clues about the direction of the economy through the end of the year and into 2013.
ADP Employment Report
According to the most recent release of the ADP employment report employers added 158,000 jobs in October. While the reported number of hires in October very slightly beat the headline estimate of 155,000 jobs, ADP recently revised their data, which has significantly changed previous reported data. Therefore, in this context, today's ADP report has to be taken at face value. Furthermore, it is important to remember that in order to be counted as "employed" by ADP an individual needs only to work for ONE hour in the given reporting period. Since Halloween is the second busiest shopping period next to Christmas there were many temporary hires for the month to support retailers. The chart below shows the revisions made to ADP's employment data. The revisions were primarily to the negative and since January of 2011 there are 178,500 few jobs than were previously reported.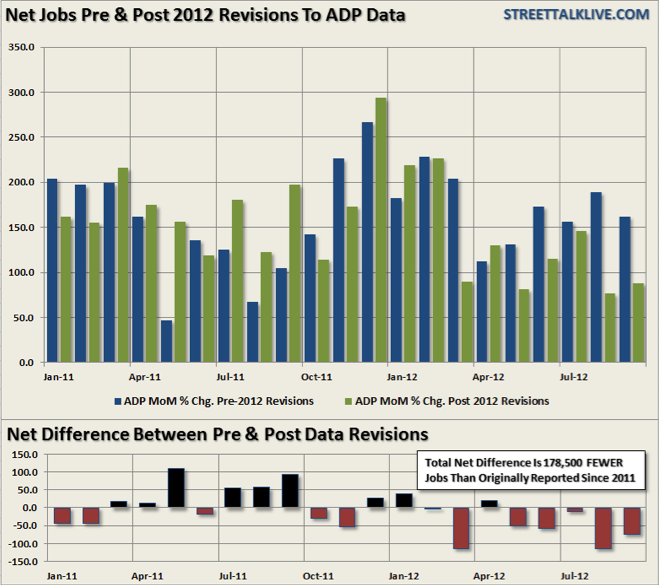
The trend of employment has been on the decline over the last several months as the impact of the recession in the Euro Zone has slowly eaten its way into the domestic economy. Today's report of 158,000 jobs is lower than the last two months of 189,000 and 162,000. This is consistent with the many manufacturing reports as of late where hiring intentions, both currently and future, have been on the decline as new orders and order backlogs have fallen.
Lastly, the hiring trend decline in ADP is likely to show up in the BLS employment report for October. Expectations are currently that the BLS will report that 125,000 jobs were created. However, if the trend in ADP is applied to the BLS report (which showed 181,000 in July, 142,000 in August, and 114,000 in September) it would be reasonable to assume that roughly 100,000 jobs were created in October.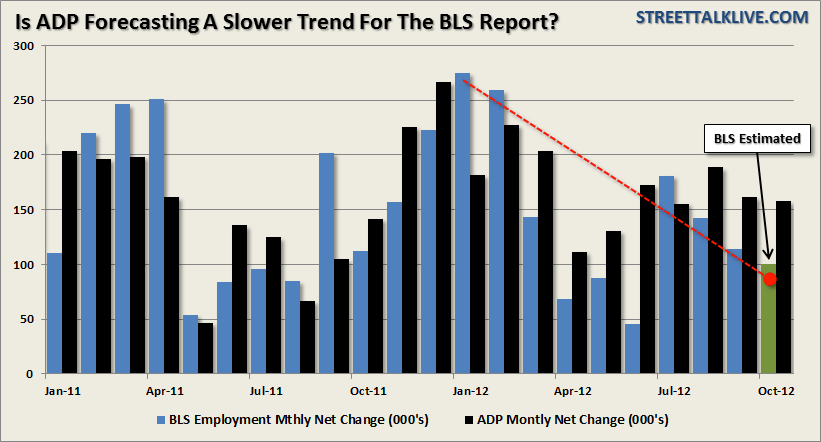
Again this would be consistent with the trend of employment intentions from the broader economic reports as well. The chart below shows the current negative trend in employment. The STA Composite employment index is comprised of the employment sub-components of the Chicago Fed National Activity Index, ISM reports, several Fed manufacturing regional reports, NFIB and the Chicago ISM PMI report.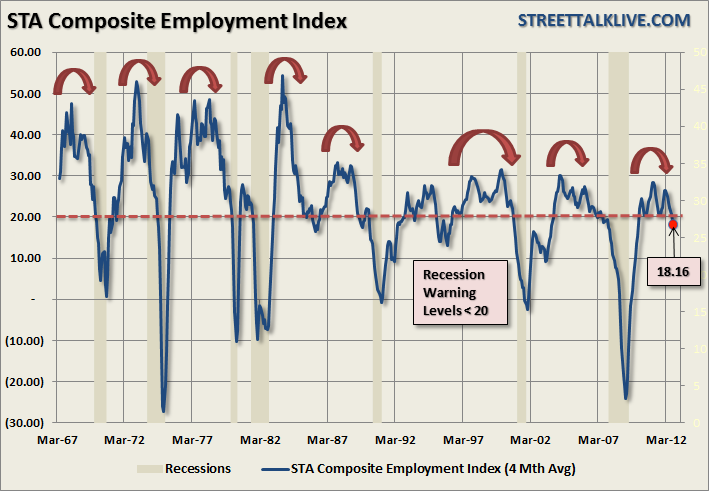
With the index now below the 20-level, which has historically indicated a more recessionary environment, we should expect to start seeing a pickup in the jobless claims reports in the weeks ahead.
Productivity, Capacity Utilization And Labor Costs
Productivity is a double edged sword. The most recent report on Productivity, Capacity Utilization and Unit Labor Costs can give us real insight into how businesses are positioning themselves in the current economic climate. While the general belief is that businesses are a fluid partner in the economy -- the reality is that businesses are at war every day with the overall economic climate in order to protect their profitability. As we have discussed recently, the slowdown in China and recession in the Euro Zone in impacting exports which now comprise a large percentage of businesses profits. When profits are under attack -- businesses become more defensive by increasing productivity, lowering costs and minimizing employment.
That is clearly shown in the most recent report from the Bureau of Economic Analysis which showed that for the third quarter of 2012 non-farm productivity increased by a healthy 1.9% while the second quarter read was revised down to 1.9% from 2.2%. However, consistent with what we have seen in the most recent quarter by manufacturers (as shown in the chart above), employment has slowed as business attempt to reign in employment related costs (benefits, insurance, taxes, etc.) to protect profitability. As a result in the latest quarter unit labor costs declined by 0.1% as wage growth decelerated. With profitability under attack as the global economy slows, which is grossly impacting top line revenue, we will likely continue to see the trend of employees "worker longer for less" continue in the coming quarters ahead.
Lastly, and most importantly, the capacity utilization rate declined in the latest quarter to 78.5 from 78.9 in the second quarter. This decline in capacity utilization is the first in the last three years. The chart below shows that when capacity utilization has turned down in the past, in combination with increases in productivity, this has generally been indicative of a more pervasive economic downturn.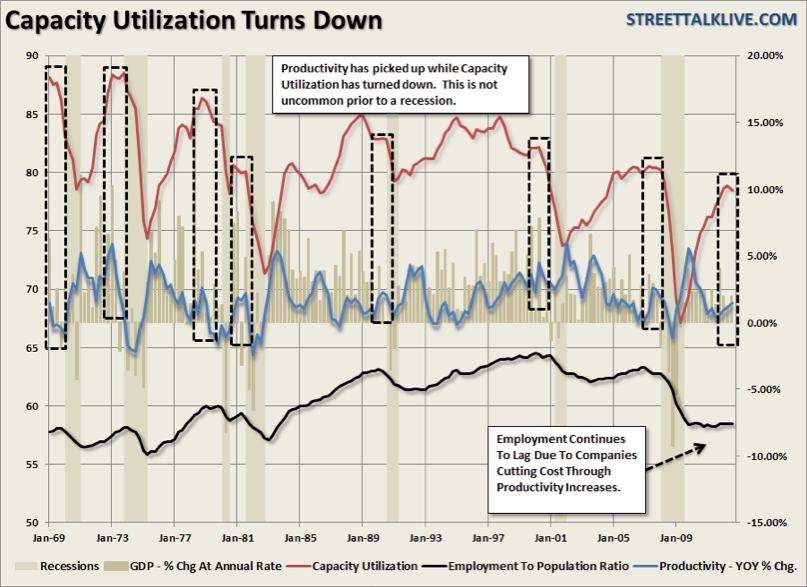
The chart above shows productivity, GDP, employment-to-population ratio and capacity utilization. This has been an extraordinarily weak economic recovery by all measures and the down turn in capacity utilization is something that we will want to continue to watch closely in the quarters ahead.
ISM Manufacturing Index
The Institute of Supply Management release of the manufacturing index showed some modest improvement at 51.7 over the prior month's read of 51.5. Digging into the subcomponents, however, reveals a more negative than positive bias. On the positive side of the ledger New Orders rose to 54.2 from 52.3, the Production Index rose to 52.4 from the contractionary read of 49.5 last month, and customer inventories fell slightly from 49.5 to 49.
Unfortunately, those positives were more than offset by Order Backlogs which fell to 41.5 from 44.0, New Export Orders declined to 48.0 from 48.5, Supplier Delivers slipped to 49.6 from 50.3, and Prices fell to 55.0 from 58.0. Most importantly to the economic picture Employment fell to 52.1 from 54.7.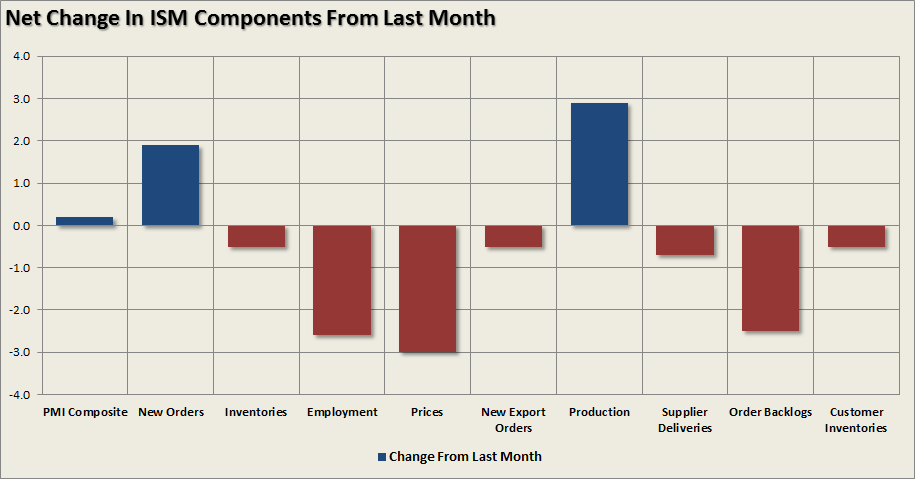
Overall, while the headline print was positive, as we have seen with several of the manufacturing indexes as of late, the internals are showing signs of deterioration. This is consistent with the overall view that the global slowdown is beginning to impact the domestic economy as we have been expecting.
Consumer Confidence
For the Fed increasing consumer confidence by boosting asset prices has been a third mandate since QE 2 was instituted in 2010. With the markets still near their highs of the year, and after having solidly advanced prior to the announcement of QE 3, consumer confidence has likewise pushed higher over the last couple of months as after slipping briefly early this summer.
While consumers were more positive in their assessment of the overall economy, jobs and business improvement it is important to keep these improvements within the context of the longer term trends. The chart below shows the consumer confidence index from 1977 to present.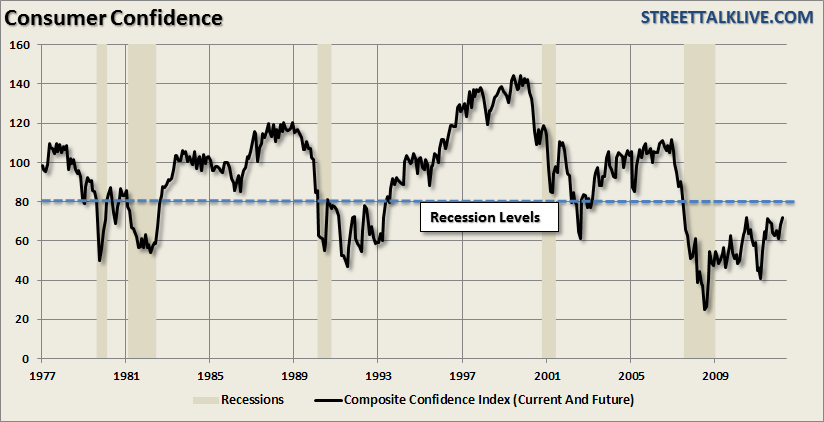
While consumer confidence has certainly improved from its lows seen in early 2009 -- confidence has now reached levels that have historically been lows of previous recessionary cycles. In other words, while consumers feel better than they did in 2009 the majority still feel as if the economy is in a recession.
No Change To Outlook
There was nothing in the most recent economic releases that changes our current outlook on the economy. The global slowdown/recession is dragging on the domestic economy as reflected by the slate of disappointed outlooks for a variety of high profile global corporations. While the Fed has fully engaged in QE 3 to try and boost employment the current trends of the employment related components in the economic reports suggest that businesses and manufacturers have other plans.
It is still our best guess at the current time that the economy will likely slip into recession in 2013. While the recent impact of Hurricane Sandy is yet to be assessed this could boost economic output in the very short term by roughly 0.5% which could push a recession in the U.S. out to the second or third quarter of 2013.
However, what is unlikely to improve in the next couple of quarters is corporate earnings. The current rate of negative revisions in earnings is likely to continue into 2013 and will potentially have a more immediate, and negative, impact on the equity markets than the Fed's interventions can offset. For investors this is a time to become more conservative in portfolio allocations, reduce risk, overweight cash and fixed income and hedge long only portfolios.
3rd party Ad. Not an offer or recommendation by Investing.com. See disclosure here or remove ads.
Which stock should you buy in your very next trade?
With valuations skyrocketing in 2024, many investors are uneasy putting more money into stocks. Unsure where to invest next? Get access to our proven portfolios and discover high-potential opportunities.
In 2024 alone, ProPicks AI identified 2 stocks that surged over 150%, 4 additional stocks that leaped over 30%, and 3 more that climbed over 25%. That's an impressive track record.
With portfolios tailored for Dow stocks, S&P stocks, Tech stocks, and Mid Cap stocks, you can explore various wealth-building strategies.