Perhaps today’s action will give more direction to the silver market as I was getting mixed technical and fundamental messages last week. Prices may have reached an interterm top this week as a correction may be underway. As one can see on the chart above prices have traded under their 50-day MA; the light blue line for the first time since prices penetrated that level last week.
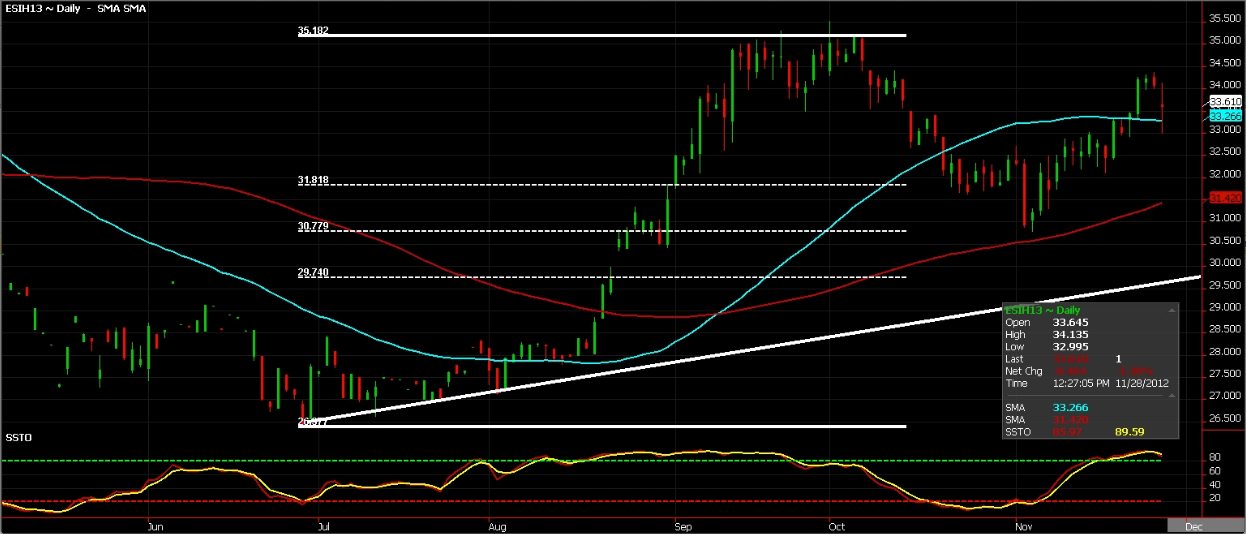
I am operating under the influence that we could see a correction in the entire metals complex. On a settlement under the 50-day MA this would be confirmed. This does not affect my longer term bullish stance, in fact I am eager to see a correction to buy for clients from lower levels. As long as the trend line identified by the white line just under $30/ounce holds I remain bullish.
Go Bearish
I’ve advised clients to gain bearish exposure by purchasing back ratio spreads in March. I am using the Fibonacci levels on the chart above as my targets on the forecasted deprecation to come. The red line is the 100-day MA which also would be a good exit point in my opinion… lying between the 38.2% and 50% Fibonacci levels.
Continue to monitor outside markets as the dollar has been able to stay above its 50-day MA and the stock market is currently challenging the down sloping trend line and to date has been able to remain above its nine-day MA. Obviously the ebb and flow of money is critical as money shifts from asset class to asset class.
Risk Disclaimer: The opinions contained herein are for general information only and are not intended to provide specific investment advice or recommendations and are not tailored to any specific’s investor’s needs or investment goals. You should fully understand the risks associated with trading futures, options and retail off-exchange foreign currency transactions (“Forex”) before making any trades. Trading futures, options, and Forex involves substantial risk of loss and is not suitable for all investors. You should carefully consider whether trading is suitable for you in light of your circumstances, knowledge, and financial resources. You may lose all or more of your initial investment. Opinions, market data, and recommendations are subject to change without notice. Past performance is not necessarily indicative of future results.
I am operating under the influence that we could see a correction in the entire metals complex. On a settlement under the 50-day MA this would be confirmed. This does not affect my longer term bullish stance, in fact I am eager to see a correction to buy for clients from lower levels. As long as the trend line identified by the white line just under $30/ounce holds I remain bullish.
Go Bearish
I’ve advised clients to gain bearish exposure by purchasing back ratio spreads in March. I am using the Fibonacci levels on the chart above as my targets on the forecasted deprecation to come. The red line is the 100-day MA which also would be a good exit point in my opinion… lying between the 38.2% and 50% Fibonacci levels.
Continue to monitor outside markets as the dollar has been able to stay above its 50-day MA and the stock market is currently challenging the down sloping trend line and to date has been able to remain above its nine-day MA. Obviously the ebb and flow of money is critical as money shifts from asset class to asset class.
3rd party Ad. Not an offer or recommendation by Investing.com. See disclosure here or remove ads.
Risk Disclaimer: The opinions contained herein are for general information only and are not intended to provide specific investment advice or recommendations and are not tailored to any specific’s investor’s needs or investment goals. You should fully understand the risks associated with trading futures, options and retail off-exchange foreign currency transactions (“Forex”) before making any trades. Trading futures, options, and Forex involves substantial risk of loss and is not suitable for all investors. You should carefully consider whether trading is suitable for you in light of your circumstances, knowledge, and financial resources. You may lose all or more of your initial investment. Opinions, market data, and recommendations are subject to change without notice. Past performance is not necessarily indicative of future results.
Which stock should you buy in your very next trade?
AI computing powers are changing the stock market. Investing.com's ProPicks AI includes 6 winning stock portfolios chosen by our advanced AI. In 2024 alone, ProPicks AI identified 2 stocks that surged over 150%, 4 additional stocks that leaped over 30%, and 3 more that climbed over 25%. Which stock will be the next to soar?
Unlock ProPicks AI