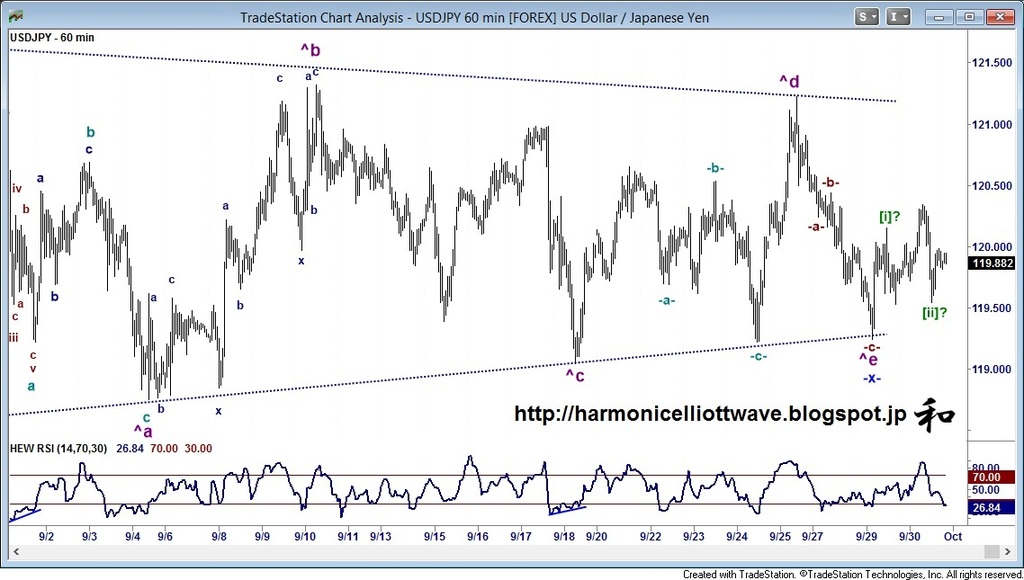
INTRADAY CHART FOR USD/JPY

BIAS: This has potential for constructive gains but needs a little more confirmation
| Resistance: | 120.34-44 | 120.51-61 | 120.80-00 | 121.23 |
| Support: | 119.75-80 | 119.54 | 119.24 | 119.05 |
MAIN ANALYSIS: Yesterday's development formed the potential base for a firmer rally. We now need to see the 119.75-80 area support to allow gains to move back above the 120.34-44 area to extend gains to 120.51-61 and following a minor correction, to the 120.80-00 area - basically holding below the 121.23 high. This should trigger losses - and we'll need to ensure this is corrective. Assuming we then see gains above 121.23 the rally should continue to around 121.71 and maybe as high as 122.26.
COUNTER ANALYSIS: On the downside, a break of 119.50 would concern and then suggest potential for losses of 118.90-05 to extend losses back to 118.75 and then 118.24-44 at least … but if the downside develops it could be quite firm.
MEDIUM TERM ANALYSIS: 29th September: This continues to look like one long, slim triangle although I've seen these develop and then break in the opposite direction... The 119.60-69 area and 119.05-20 area is the key on the downside with breach extending losses... On the other side, a break above 121.23 and 121.63 will edge this closer to the Wave [b] at 125.27...
Which stock should you buy in your very next trade?
With valuations skyrocketing in 2024, many investors are uneasy putting more money into stocks. Unsure where to invest next? Get access to our proven portfolios and discover high-potential opportunities.
In 2024 alone, ProPicks AI identified 2 stocks that surged over 150%, 4 additional stocks that leaped over 30%, and 3 more that climbed over 25%. That's an impressive track record.
With portfolios tailored for Dow stocks, S&P stocks, Tech stocks, and Mid Cap stocks, you can explore various wealth-building strategies.
