Crude oil soars nearly 4% on Friday as Saudi Arabia puts the boot in, while gold marks a bearish outside reversal after hitting 1300.
Oil
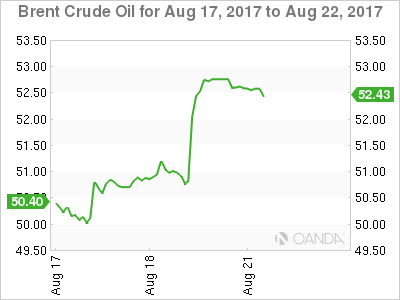
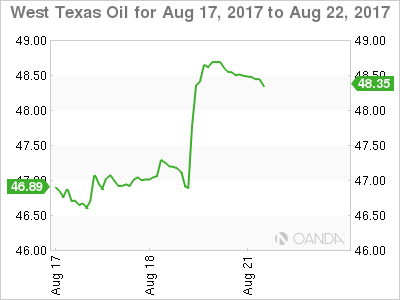
Oil prices rocketed higher on Friday as Brent and WTI climbed nearly four percent in the New York session. Despite huge inventory drawdown data during the week, oil had continued to fall, and Friday’s price action resembled a comeback that Mohammed Ali would have been proud of. The rally was to some extent, driven by short covering in a thin market after heavy selling all week. But the primary driver appears to be news that Saudi Arabia’s crude exports have fallen to a three year low of 6.9 million barrels a day.
Along with cutting exports to the United States, the Saudi’s appear to be following their forward guidance to the letter having previously said they would cut exports to 6.6 million barrels a day by the end of August. This further cements our view that Saudi Arabia is the swing producer of last resort globally and their apparent intent has been received by markets positively.
Technically the price action has been very bullish as well with Brent spot smashing through its 200-day moving average and first support at 51.70 to close near its highs at 52.85. The next resistance is the 10th August high at 53.45 and then 54.50.

WTI spot trades slightly lower than its Friday close around 48.50 on some post-weekend profit taking having broken up through its 200-day moving average at 47.75 on Friday. It still has more work to do compared to Brent with wood to chop at 49.15 ahead of its 200-day moving average at 49.25 initially. Further resistance is at seen in the 50.00/50.30 zone.

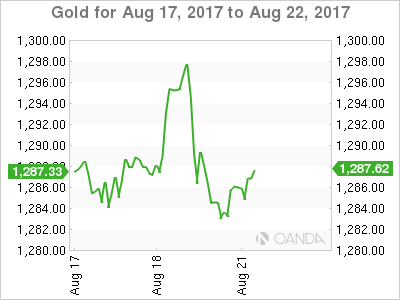
Gold leapt to its 2017 high on Friday, trading up 13 dollars from its open to break the magical 1300.00 level and briefly touch 1301.00. After that, however, the price action was extremely disappointing as it plunged all the way back to finish below its open at 1285.00.
A combination of a weaker dollar, terrorist attacks, and a sell-off in equities certainly helped, but the price action mostly has a stop loss driven short covering look about it. A break of the longer term resistance at 1296.00 triggering stop losses with more seen as options structures at 1300.00 strikes were taken out. The fact that gold did not loiter above 1300.00 speaks volumes as to the drivers of the move higher and the subsequent fall.
Additionally, weekend risk hedging buying was seen into the New York close. This further reinforces the natural of Friday’s rally as if the street has been worried about weekend geopolitics gold would have traded higher into its Friday close.
Unsurprisingly, gold is a couple of dollars lower at 1283.00 this morning with the danger now that more longs will look for the exit on any moves lower. Gold has resistance around 1290.00, but it is the support at 1280.00 initially that traders will be concentrating on more. A break of this level opens further losses to the 1267.00 area.

