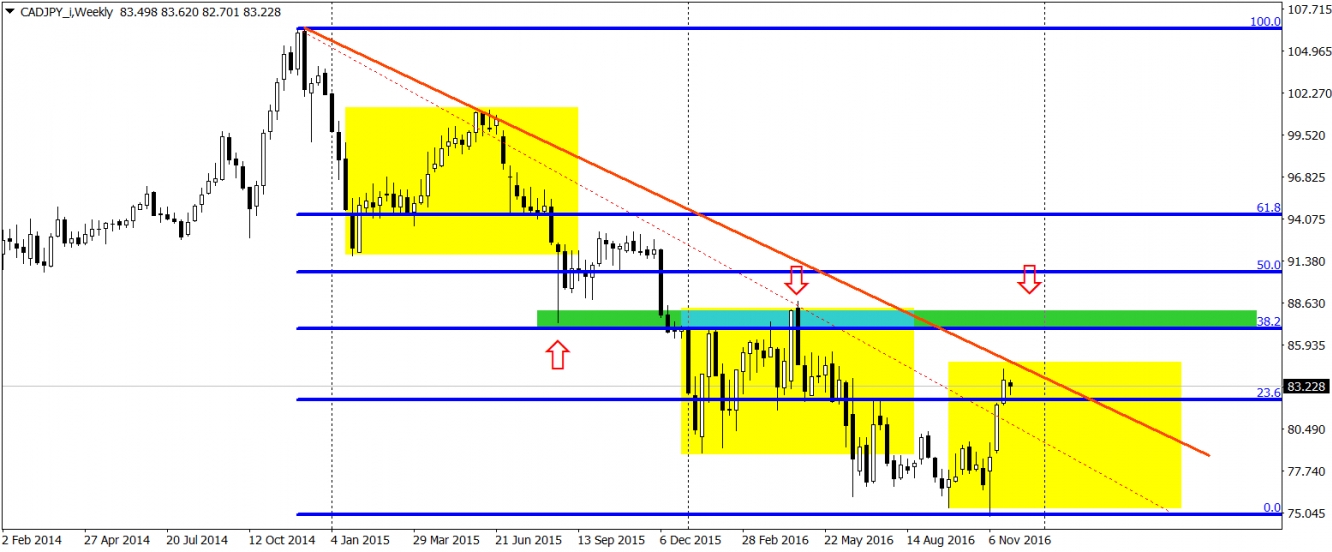
Since 2014, CAD/JPY has been in a strong downtrend, which so far was interrupted by three major correction movements. All of them were very similar in terms of depth, having around 950-1000 pips. Two of them ended some time ago. The third one is happening right now. It is a bit too early to say if the third one is about to end this week or the next one but some technical signals suggest that we may expect a comeback to the long-term bearish trend relatively soon.
Apart from the fact that we just retraced around 950 pips, we also do have a downtrend line here (red). If the correction equality and a trendline is not enough for you, what about looking a little bit higher? 270 pips above (green line) we do have a 38.2% Fibonacci and a line being a support on the August 2015 and a resistance on the April 2016. Both places looks decent and seems ready for a potential bounce.
In such cases, all you should do is to wait. Wait for the price action on those potential resistances. If you will see a bearish reversal pattern on the first one, act. If not, wait for the second one. Act only if price action will suggest a reversal and remember that resistance is just a theoretical place where price can but does not have to bounce. Although breakouts are less probable, they do happen.
Which stock should you buy in your very next trade?
AI computing powers are changing the stock market. Investing.com's ProPicks AI includes 6 winning stock portfolios chosen by our advanced AI. In 2024 alone, ProPicks AI identified 2 stocks that surged over 150%, 4 additional stocks that leaped over 30%, and 3 more that climbed over 25%. Which stock will be the next to soar?
Unlock ProPicks AI
