Get 40% Off
⚠ Earnings Alert! Which stocks are poised to surge?
See the stocks on our ProPicks radar. These strategies gained 19.7% year-to-date.
Unlock full list

Commodity Gains And Losses 2018: Keep An Eye On Dr. Copper

Published 04/22/2018, 12:12 AM
Updated 07/09/2023, 06:31 AM

The following three graphs show the percentages gained/lost for commodities for:

  • 2018 (Oil and Gasoline have been the big winners),
  • the month of April (Copper and Silver have joined Oil and Gasoline as the biggest gainers), and
  • the past week (Silver and Copper have gained the most, followed by Oil and Gasoline).


Commodities Performance YTD
Commodities Performance 29 March-20 April 2018
Commodities Weekly 13-20 April 2018
The following 1-year and 2-month charts of these commodities show their price relative to their 50-day MA, as well as their prior swing highs/lows, all of which form their respective resistance/support levels.

The expanding swings on the rate-of-change indicator (and new 2-month ROC swing high) on Copper and Silver reflect the recent buying in these two metals. I've shown it with an input value of 1 day to measure its strength/weakness from one day to the next to depict short-term interest. So, it's one indicator that can be monitored to gauge potential sustainability of any further rally next week and beyond...at the moment, it's hinting of further strength to come.
Commodities 1-Y Performance
Commodities 2-M Performance Charts
Lastly, the following monthly chart of Copper shows longer-term major resistance and support (as defined by overlapping Fibonacci retracement levels) around 3.30 and 2.94, respectively. A breakout (and hold) above or below this tightly congested zone could produce a sizable move to follow.

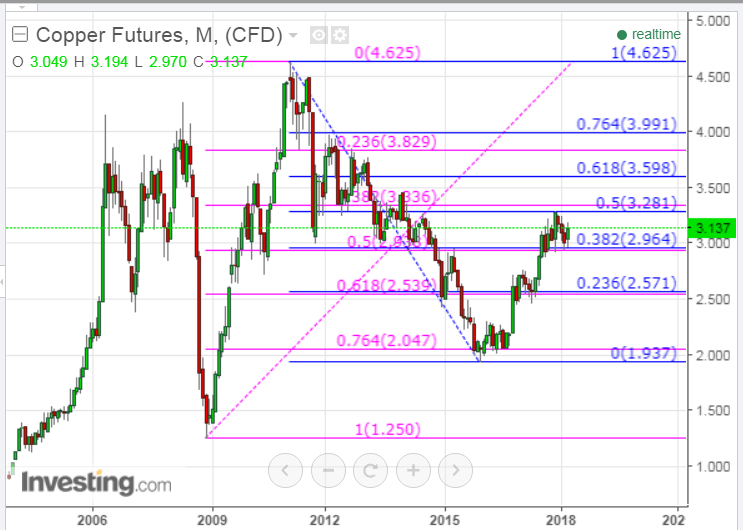
Copper Monthly 2005-2018

Latest comments

Risk Disclosure: Trading in financial instruments and/or cryptocurrencies involves high risks including the risk of losing some, or all, of your investment amount, and may not be suitable for all investors. Prices of cryptocurrencies are extremely volatile and may be affected by external factors such as financial, regulatory or political events. Trading on margin increases the financial risks.
Before deciding to trade in financial instrument or cryptocurrencies you should be fully informed of the risks and costs associated with trading the financial markets, carefully consider your investment objectives, level of experience, and risk appetite, and seek professional advice where needed.
Fusion Media would like to remind you that the data contained in this website is not necessarily real-time nor accurate. The data and prices on the website are not necessarily provided by any market or exchange, but may be provided by market makers, and so prices may not be accurate and may differ from the actual price at any given market, meaning prices are indicative and not appropriate for trading purposes. Fusion Media and any provider of the data contained in this website will not accept liability for any loss or damage as a result of your trading, or your reliance on the information contained within this website.
It is prohibited to use, store, reproduce, display, modify, transmit or distribute the data contained in this website without the explicit prior written permission of Fusion Media and/or the data provider. All intellectual property rights are reserved by the providers and/or the exchange providing the data contained in this website.
Fusion Media may be compensated by the advertisers that appear on the website, based on your interaction with the advertisements or advertisers.
© 2007-2024 - Fusion Media Limited. All Rights Reserved.