These could be the 5 biggest pain trades in the second half, HSBC says
Global lethargy or naivety, you choose. The VIX’s fall puts the skids under oil and gold.
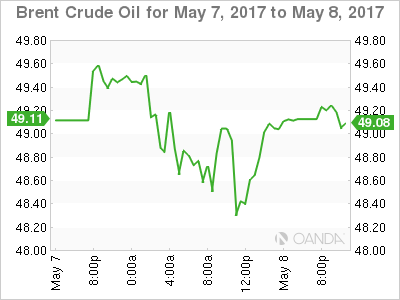
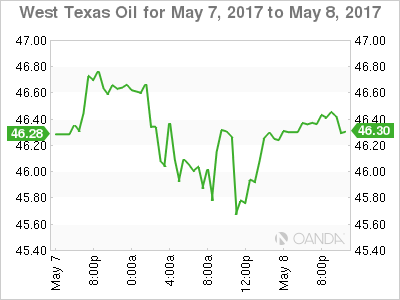
Oil continued its rebound overnight but could not hold onto the gains with both Brent and WTI spot finishing roughly unchanged from the previous day. Soothing words from Saudi Arabia about extending the production cut deal, possibly into 2018, supported prices for most of the day until a resurgent US dollar took the heat out of the rally.
Oil will continue to be headline driven as we head into tomorrow’s crude inventory figures. However, one suspects that OPEC’s comments to talk up crude are already generating diminishing returns with both contracts still trading at the bottom end of their long term ranges
Brent
Brent spot trades at 49.10 this morning in Asia with resistance at 50.00 and support near the overnight low around 48.15.

WTI
WTI spot trades 46.35 with resistance at 47.00 and support initially at 45.50. A break of the latter may see newly minted longs at these levels heading for the exit door.

Gold
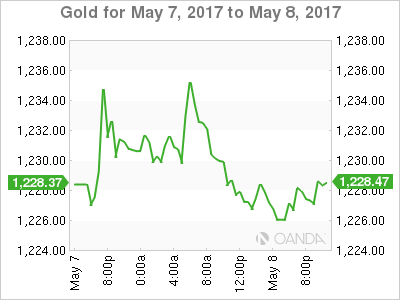
Gold’s nascent rally petered out overnight, and gold fell to open in Asian trading around 1227.50. Yesterday’s post-Macron, victory-commodity-and-risk-rally ran into a brick wall in European trading as traders booked profits across most asset classes. A resurgent dollar saw the CBOE Volatility Index (VIX) fall to 9.77%, its lowest since 1993, suggesting the market thinks the world is a safer place than at any time in the last 25 years.
Whether you consider this a gross mis-pricing of risk or not, the fall of the VIX further hollows out the safe haven bid that has underpinned gold for most of 2017. Should volatility remain becalmed, gold may find itself on the losing end of a deeper correction to the downside.
Gold this morning has initial resistance at yesterday’s high of 1236.50, followed by 1241.60. It is hovering rather nervously above the 100-day moving average at 1223.00 and then 1221.50, yesterday’s low. A close below these levels signalling the next possible down leg could be near.

Which stock should you buy in your very next trade?
With valuations skyrocketing in 2024, many investors are uneasy putting more money into stocks. Unsure where to invest next? Get access to our proven portfolios and discover high-potential opportunities.
In 2024 alone, ProPicks AI identified 2 stocks that surged over 150%, 4 additional stocks that leaped over 30%, and 3 more that climbed over 25%. That's an impressive track record.
With portfolios tailored for Dow stocks, S&P stocks, Tech stocks, and Mid Cap stocks, you can explore various wealth-building strategies.
