
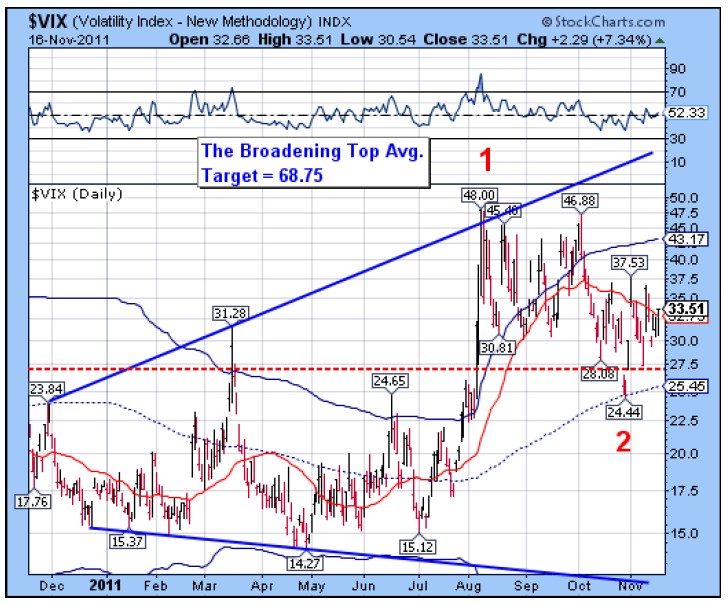
-- The VIX broke above its intermediate-term support/resistance at 32.63 today. This confirms the buy signal already given at the reversal above daily mid-cycle support at 24.64 and weekly mid-cycle support at 27.30. The cycles suggest a rising VIX through early to mid-December.
I would like to remind my readers that the May 6, 2010 flash crash began soon after the VIX crossed above its intermediate-term trend support.

SPX crossed below a small Head and Shoulders neckline at 1138 .50 with a minimum target of 1160.00. However, a gap down on Thursday morning of options week could lead to panic selling and a more likely target below 1000 in the SPX. There is a diamond formation in the hourly chart which suggests a probable target of 968.00.
Technically speaking, there is nothing but air between 1219.70 and 1076.00. The broadening flag formation now needs to have its lower trendline (near 1040) violated. The after-hours market continues its decline. The SPX remains on a cyclical sell signal below its mid-cycle resistance at 1264.05. That signal is confirmed once intermediate-term trend support is broken at 1219.70.

The USD rallied out of its Broadening Bottom trendline near 78.00 and challenged cycle top resistance at 78.34 today. This activates a minor inverted Head and Shoulders pattern whose neckline corresponds with the upper trendline with a minimum target of 80.88. This, in turn, may activate the larger inverted head and shoulders pattern with this minimum target of 87.00. However, the USD may pullback in a small consolidation before moving higher again.
The story being told by the chart patterns is that of a series of Cascades, one cascade leading the next. I may have to go back to the weekly charts in the weekend update in order to get the bigger picture of what's unfolding at the macro level..

The Euro is now at a crossroads to determine whether it continues to decline through cycle bottom support, or do a brief consolidation. Since it is options expiration week, a consolidation back to intermediate-term trend resistance at 137.01 would not be out of the question. However, many stop losses may have been broken here so it is unclear whether the market may continue its decline or not. In panic situations, markets tend to remain oversold during the decline.

USB may have executed a reversal pattern by bouncing off intermediate-term trend support at 140.10. The proof of that statement will be delivered by a decline below the 140.10 support. I am still neutral until USD breaks solidly in one direction or the other.

Gold broke through the lower trendline of its bearish wedge formation and bounced back on a retest of the trendline. This not puts the precious metal on a sell signal that may be confirmed by crossing below intermediate-term trend support at 1705.43 The next support levels are, mid-cycle support at 1614.75, followed by the lower trendline of the Orthodox Broadening Top, approaching 1550.00.
The cycles suggest an approximate two week decline into the trading cycle low. If this next low exceeds the September 26 low, the rally following it will fail and we will see the 2011 low in gold near the end of December.
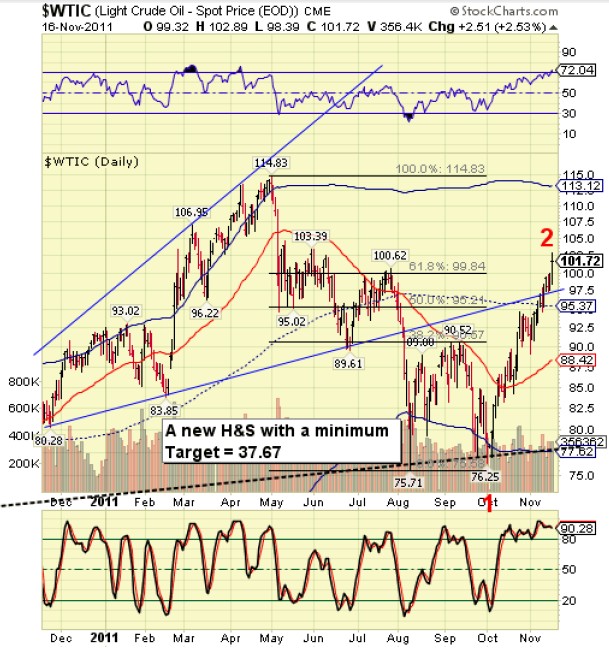
West Texas Crude may have been reintroduced to the concept of gravity today. Today is the exact halfway peak of the Primary Cycle and a Cycle Turn date in oil. This suggests a potential drop in the price of oil into early December. Should the neckline be broken by then, the decline may continue through the end of the year.
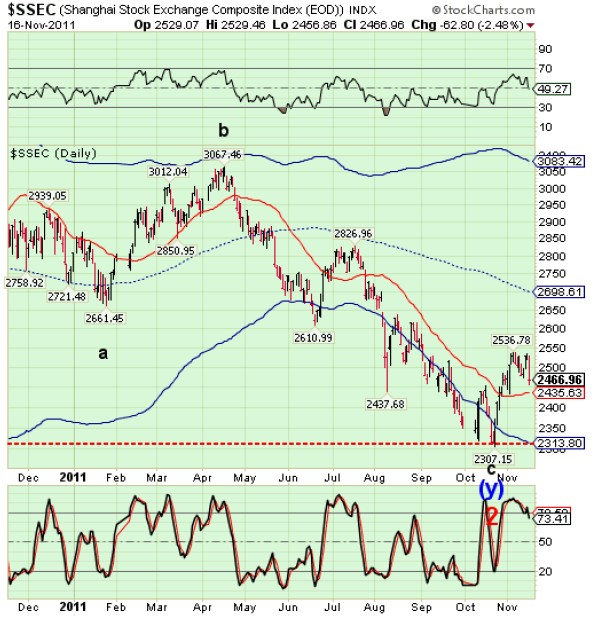
The Shanghai Index declined today but remains above its intermediate-term trend support at 2435.63. The Chinese stock market remains on a probable buy signal. While the US and European markets are due for a spanking over the next three weeks, I would like to see how well the Chinese market holds up through it all. A breakout above 2536.78 would confirm the buy signal, but it appears that FXI may come a little more under the influence of US markets. If so, I would buy the breakout in FXI as well. The interesting thing is that the Shanghai index appears to fit hand in glove with the US dollar index going forward.