
Riding on higher revenues, Citizens Financial Group (NYSE:CFG) delivered a positive earnings surprise of 2.6% in first-quarter 2018. Earnings per share of 78 cents topped the Zacks Consensus Estimate of 76 cents. Also, the reported figure compares favorably with adjusted earnings of 57 cents recorded in prior-year quarter.
The company experienced continued expansion of margins and loan growth, which aided higher revenues. Also, higher deposits and lower provisions were some other positives. However, increase in expenses and lower fee income were the main undermining factors.
The company reported net income of $388 million compared with $320 million recorded in year- ago quarter.
Increase in NII Partially Offset by Higher Expenses and Lower Fee Income
Total revenues for the quarter were $1.46 billion, which lagged the Zacks Consensus Estimate of $1.47 billion. However, revenues were up 6% year over year.
Citizens Financial’s net interest income (NII) increased 9% year over year to $1.09 billion. The rise was primarily attributable to average loan growth and improved margin. In addition, net interest margin expanded 20 basis points (bps) year over year to 3.16%. This was mainly due to higher interest-earning asset yields given balance sheet optimization initiatives and improving loan mix, partly mitigated by increase in funding costs.
Also, non-interest income declined 2% to $371 million. The fall was due to lower capital markets fees and other income, partially offset by higher mortgage banking fees, trust and investment services, and card fees.
Non-interest expenses were up 3% year over year to $883 million. The increase reflects rise in almost all components, except other expenses.
Efficiency ratio declined to 60% in the first quarter from 62% in the prior-year quarter. Generally, lower ratio is indicative of the bank’s improved efficiency.
As of Mar 31, 2018, period end total loan and lease balances increased nearly 1% sequentially to $112.2 billion while total deposits increased marginally from the prior quarter to $115.7 billion.
Credit Quality Improves
As of Mar 31, 2018, net charge-offs for the quarter declined 20% year over year to $70 million. Provision for credit losses fell 19% to $78 million. Additionally, total non-performing loans and leases were down 17% to $868 million.
However, allowance for loan and lease losses increased 2% to $1.25 billion on a year-over-year basis.
Capital Position
Citizens Financial remained well capitalized in the quarter. As of Mar 31, 2018, Common Equity Tier 1 capital ratio was 11.2%, flat year over year. Further, Tier 1 leverage ratio came in at 10%, up 1 bp from the year-ago quarter. Total Capital ratio was 13.9% compared with 14% in the prior-year quarter.
Capital Deployment Update
As part of its 2017 Capital Plan, the company repurchased 3.9 million shares during the quarter. Notably, including common stock dividends, the company returned $283 million to its shareholders.
Our Viewpoint
Results highlight a decent quarter for Citizens Financial. We are optimistic as the company continues make investments in technology in order to improve its customers’ experience. Further, with a diversified traditional banking platform, Citizens Financial is well poised to benefit from the recovery of economies where it has footprint. However, decline in fee income and elevated expenses remain key concerns.
Citizens Financial Group, Inc. Price, Consensus and EPS Surprise
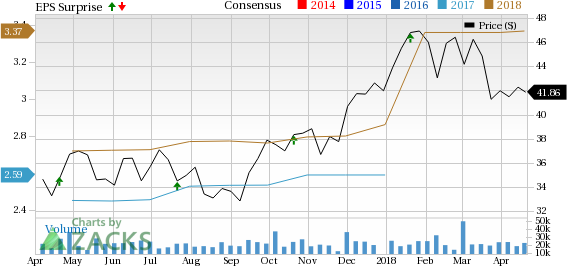
Citizens Financial Group, Inc. Price, Consensus and EPS Surprise | Citizens Financial Group, Inc. Quote
Citizens Financial carries a Zacks Rank #3 (Hold). You can see the complete list of today’s Zacks #1 Rank (Strong Buy) stocks here.
Performance of Other Banks
Driven by top-line strength, Texas Capital Bancshares (NASDAQ:TCBI) delivered a positive earnings surprise of around 0.7% in first-quarter 2018. Earnings per share of $1.38 outpaced the Zacks Consensus Estimate by a penny. Moreover, results compared favorably with 80 cents recorded in the prior-year quarter.
BancorpSouth (NYSE:BXS) reported first-quarter 2018 operating earnings of 54 cents per share, beating the Zacks Consensus Estimate of 50 cents. Also, the bottom line compared favorably with the year-ago quarter earnings of 41 cents.
U.S. Bancorp’s (NYSE:USB) first-quarter 2018 adjusted earnings per share of 95 cents surpassed the Zacks Consensus Estimate by a penny. The figure came in ahead of the prior-year quarter earnings of 82 cents.
Wall Street’s Next Amazon (NASDAQ:AMZN)
Zacks EVP Kevin Matras believes this familiar stock has only just begun its climb to become one of the greatest investments of all time. It’s a once-in-a-generation opportunity to invest in pure genius.
Click for details >>
U.S. Bancorp (USB): Free Stock Analysis Report
BancorpSouth Bank (BXS): Free Stock Analysis Report
Texas Capital Bancshares, Inc. (TCBI): Free Stock Analysis Report
Citizens Financial Group, Inc. (CFG): Free Stock Analysis Report
Original post