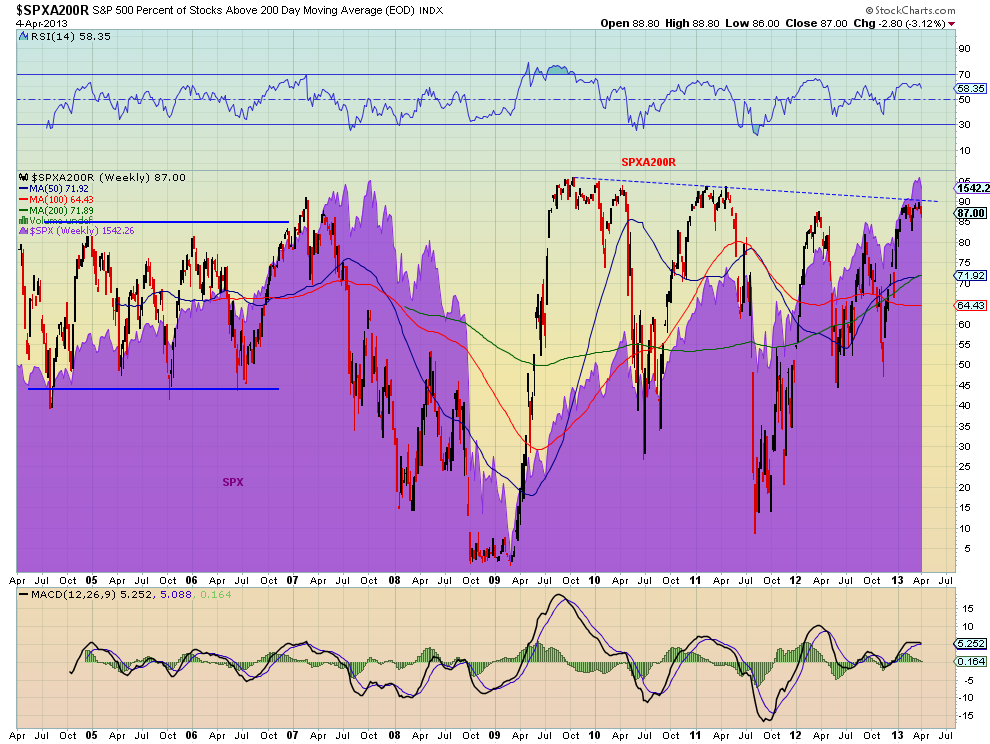
I have been very bullish over the last 6 months. Although the trend remains higher, there are measures of caution that suggest to tighten stops or protect. One of those measures us the Percentage of stocks over their 200 Day Simple Moving Average (SPXA200R). The chart below shows this over time with the backdrop of the S&P 500.
(SPX). Notice that the data series has reached the trend resistance. not extreme, but high. It does not mean it will correct lower, but it does create another point to reflect on as the markets are at new highs. Markets are starting lower Friday morning at the time of writing, but are holding at not so bad levels. Using this series as a guide, it may need to be a lot more to get it down under 50%.
The information in this blog post represents my own opinions and does not contain a recommendation for any particular security or investment. I or my affiliates may hold positions or other interests in securities mentioned in the Blog, please see my Disclaimer page for my full disclaimer.
Original post
Which stock should you buy in your very next trade?
AI computing powers are changing the stock market. Investing.com's ProPicks AI includes 6 winning stock portfolios chosen by our advanced AI. In 2024 alone, ProPicks AI identified 2 stocks that surged over 150%, 4 additional stocks that leaped over 30%, and 3 more that climbed over 25%. Which stock will be the next to soar?
Unlock ProPicks AI