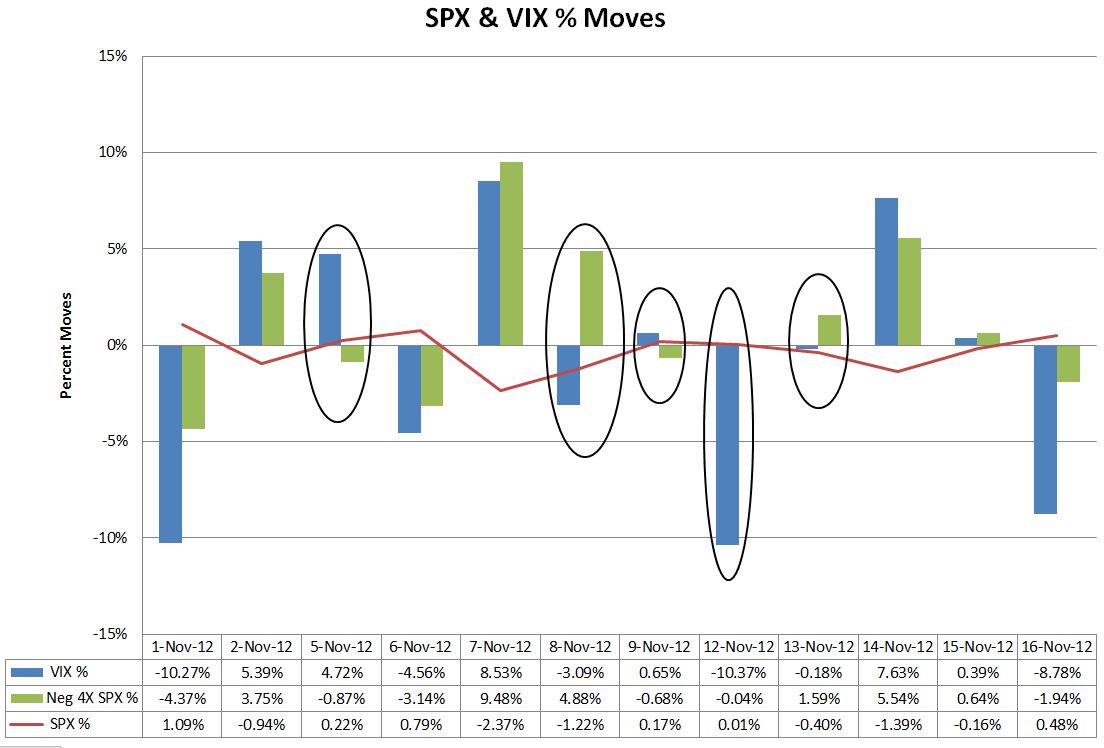
The last couple of weeks there’ve been a lot of comments about the CBOE’s VIX Index being broken or manipulated. Generally I expect the percentage moves in the VIX to be around a factor of four in the opposite direction of SPX (S&P 500). But there are significant eccentricities in the VIX that I factor in. For example Fridays tend to be down days, Mondays tend to be up.
The chart below shows the percentage moves at close for VIX (blue bars) and SPX (red line) for the first 12 trading days of November, along with my -4X rule of thumb (green bars). The black ovals show five days where the VIX went opposite the expected direction. In addition, on two days, the first and the 16th, the VIX moved far more than a -4X factor.
One of these days, the 12th, has at least a partial explanation. That was the day that the VIX calculation shifted from using November / December SPX options to December / January options. If you’re interested see Bill Luby’s post for more information on this phenomenon.
Historic Ratios
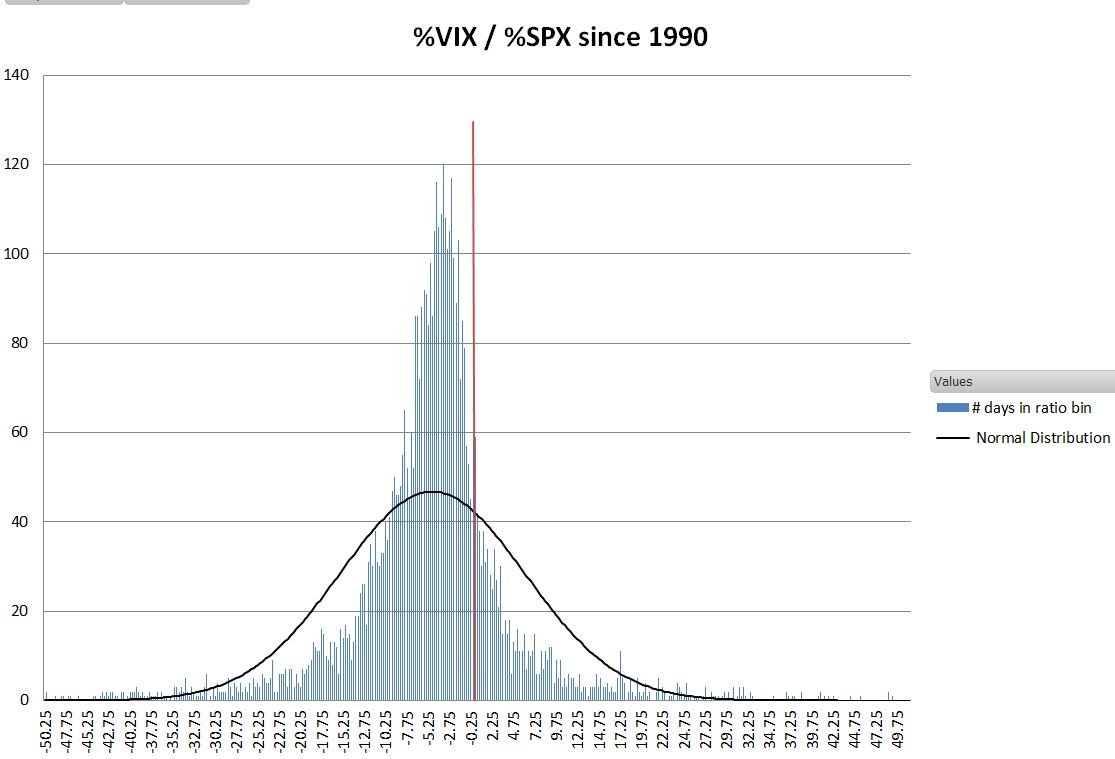
I did an analysis of SPX and VIX since 1990 to see the actual historical ratios between their percentage moves. I excluded daily SPX percentage moves of less than +-0.1% because they often give very high, nonsensical ratio values. 
The average ratio value was -4.77, but as you can see there is a wide spread. About 20% of the time the ratio is positive (data to the right of the red line).
Each of the blue bars in the histogram shows how many days had a VIX%/SPX% ratio in each 0.25 wide bin. For example there were 120 days where the ratio was between -3.25 and -3.5. I also plotted a normal distribution, which shows this distribution is more concentrated and has wider tails than a Gaussian distribution.
Don't Fear The VIX
While not broken, and probably not manipulated, the VIX as a fear gauge leaves a lot to be desired. Given its past performance it’s not reasonable to expect it to negatively correlate with the S&P 500 every day. However I think it does give us a very good feel for the mood of the SPX options market. A single SPX option has the leverage of a $130K+ investment in the S&P 500, so it tends to be the domain of professional / institutional investors. They aren’t always right, but they aren’t dummies, and they’re voting with their wallets. Last week they were trading as if they thought the market decline was over, and at least for today, it looks like they were right.
Which stock should you buy in your very next trade?
With valuations skyrocketing in 2024, many investors are uneasy putting more money into stocks. Unsure where to invest next? Get access to our proven portfolios and discover high-potential opportunities.
In 2024 alone, ProPicks AI identified 2 stocks that surged over 150%, 4 additional stocks that leaped over 30%, and 3 more that climbed over 25%. That's an impressive track record.
With portfolios tailored for Dow stocks, S&P stocks, Tech stocks, and Mid Cap stocks, you can explore various wealth-building strategies.
